A novel neuromagnetic response specific to the processing of pitch in human auditory cortex
From CNBH Acoustic Scale Wiki
There have been several attempts to use the neuromagnetic response to the onset of a tonal sound (N100m) to study pitch processing in auditory cortex. Unfortunately, a large proportion of the N100m is simply a response to the onset of sound energy, independent of whether the sound produces a pitch. The current study describes a novel stimulus paradigm designed to circumvent the energy-onset response and thereby isolate the response of those neural elements involved in pitch processing. The temporal resolution of magnetoencephalography enables us show that the latency and amplitude of this pitch-onset response (POR) vary with the pitch and pitch strength of the tone. The spatial resolution is sufficient to show that source lies somewhat anterior and inferior to that of the N100m.
Katrin Krumbholz , Roy Patterson
Contents
|
INTRODUCTION
Pitch is important in virtually all aspects of hearing; it is the basis of melody in music and prosody in speech. Recent fMRI studies indicate that there are specialized neural assemblies for pitch processing in the antero-lateral part of Heschl’s gyrus (Griffiths et al., 1998, 2001; Patterson et al., 2002). The purpose of the current study was to use the superior temporal resolution of MEG to investigate the dynamics of pitch processing in this region of auditory cortex. Previous neuromagnetic studies of hearing have tended to focus on the prominent negative response that peaks about 100 ms after the onset of a sound (N100m) (e.g., Pantev et al., 1989, 1996, 1998; Langner et al., 1997), or the magnetic ‘mismatch negativity’ (MMN) which occurs somewhat later and is associated with the occurrence of a novel stimulus in a sequence of familiar sounds (Näätänen, 1992).
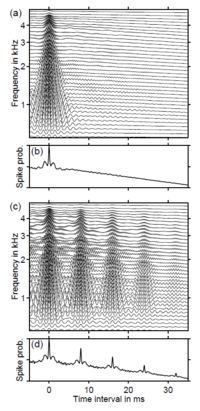
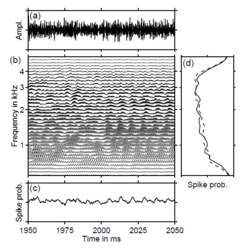
Bilsen (Bilsen, 1966) and later Yost (Yost, 1996) have shown that it is possible to manipulate the temporal structure of a random noise on the millisecond time scale and increase the regularity of time intervals between local waveform peaks, thereby introducing a pitch into the perception of the sound without changing the energy or producing harmonically spaced peaks in the tonotopic distribution of the neural activity elicited by the sound. The current study shows that this regular-interval (RI) sound makes it possible to segregate the cortical response to the onset of sound energy from that associated with the processing of temporal regularity, and thus to segregate the source associated with the processing of pitch in auditory cortex. Griffiths and colleagues have used RI sounds and functional brain imaging to confirm the common hypothesis that there is a hierarchy of pitch processing in the auditory pathway beginning in sub-cortical structures (Griffiths et al., 2001) and extending up through HG out onto planum polare (PP) and planum temporale (PT) (Griffiths et al., 1998). In the most recent study (Patterson et al., 2002), they showed that the antero-lateral part of HG is particularly sensitive to the contrast between RI sounds and noise, and they concluded that this region was concerned with the extraction of pitch information from representations created in sub-cortical structures. They also inverted the contrast to try and identify regions where noise produced more activation than tonal sounds and, intriguingly, found none whatsoever, anywhere in the auditory pathway. The importance of lateral HG in pitch processing has also been emphasized by Gulschalk et al. (2002) who contrasted the MEG responses to regular and irregular click trains (CTs) with varying sound levels. They found a double dissociation involving a source in lateral HG that was sensitive to CT regularity but not to CT level and a source in PT that was sensitive to CT level but not to CT regularity. In previous studies with RI sounds, the different stimulus conditions were presented separately in discrete trials with silence between them; in this case, the MEG onset response is dominated by the N100m. This paper introduces a new paradigm in which a continuous sound is constructed from a segment of noise and a segment of RI sound with the same energy and a very similar spectral profile. Perceptually, the sound comes on with a hiss characteristic of random noise and then it changes to a musical note with a distinct pitch and a timbre rather like a ‘cracked’ bassoon. The effect of the manipulation is limited to the temporal microstructure of the sound; the neural tonotopic representation and its gross temporal structure are essentially unchanged. This is illustrated in Fig. 1. Panel (a) shows the waveform of a noise that becomes a RI sound at 2000 ms, and panel (b) shows the simulated neural response to the stimulus at the output of the cochlear. Each horizontal line in panel (b) shows the spike probability in an individual auditory nerve fiber as a function of the fiber’s best frequency. The transition from the noise to the RI sound is almost invisible in the waveform (a), and the pattern of the neural response at the output of the cochlear is similar before and after the transition (b). In particular, the transition produces no discontinuity in the average activity over frequency (c), nor does it change the distribution of the time-averaged activity across frequency (d). The temporal regularity that distinguishes the RI sound from the noise can be represented in the time-interval histograms of the neural activity patterns before and after the transition from noise to RI sound. Each horizontal line in panels (a) and (c) of Fig. 2 shows the distribution of time intervals between neural spikes in the corresponding channel of the simulated neural response (Fig. 1a) to the noise and the RI sound, respectively. The microstructure of noise is completely random, so the distribution of time intervals is uniform in all frequency channels (the concentration at 0 ms simply indicates the presence of activity in the channel). In contrast, the temporal regularity in the RI sound produces a concentration of time intervals at 8 ms and integer multiples thereof. The pattern is present at all frequencies, so these time intervals appear as vertical ridges in this representation. The ridges represent the pitch-related information in RI sounds. The ridges produce peaks in the average time-interval histogram (Fig. 2d). The vertical location of the first peak (8 ms) corresponds to the reciprocal of the perceived pitch (125 Hz). The height of the peak increases with the degree of temporal regularity in the stimulus, which also increases the strength, or salience, of the pitch. The perceptual change at the transition from noise to RI sound is accompanied by a prominent deflection in the magnetic field. In this paper we report a systematic investigation of this novel ‘pitch-onset response’ (POR), and we compare its latency to the time required to form a stable estimate of the pitch of RI sounds perceptually. There is also a striking asymmetry inasmuch as the reverse transition from RI sound to noise produces essentially no deflection in the MEG response. In the current experiments, the neuromagnetic response to the transition from a noise to a RI sound was measured as a function of stimulus parameters that control the pitch of the RI sound and its salience, to determine whether the amplitude and/or latency of the magnetic response reflect pitch and/or pitch strength, and whether the location of the source is the same as that of the N100m. The stimulus in each trial of these experiments consisted of two segments: a 2000-ms ‘standard’ segment intended to produce an onset response, followed by a 1000-ms ‘test’ segment intended to produce a ‘change of information’ response. In the first two experiments, the standard was a random noise and the test stimulus was a RI sound. In the third experiment, the standard and test sounds were reversed, so the standard was a RI sound and the test was a noise. The RI sounds were produced from a random noise by a delay-and-add process (Yost, 1996); a broadband noise was delayed by d ms and added back to the original, and the process was repeated n times. Each cycle of the delay-and-add process is referred to as an iteration. Iteration increases the degree of regularity in the waveform by increasing the number of time intervals at the delay. The pitch of the sound (in kHz) corresponds to the reciprocal of the delay (in ms) and the pitch strength, or salience, increases with the number of iterations, n. When n is 2, the tonal component of the sounds is weak but clearly audible; when n is 8 or more, the tonal component dominates the perception.
MATERIAL AND METHODS
Stimuli and listeners
The sounds used in the current experiments were presented at 65 dB hearing level and they were filtered to remove energy below 0.8 kHz and above 3.2 kHz. The sounds were produced by a speaker (compressor driver type) outside the magnetically shielded measuring room and delivered to the listener’s right ear via 6.3 m of plastic tubing with an inner diameter of 16 mm. Each stimulus was presented 100 times during the course of the experiment and the order of the conditions was randomized. The inter-trial interval was 5 s. The standard and test sounds were gated on and off with 5-ms cosine-squared ramps. At the transition from standard to test sound, the ramps overlapped so that the envelope of the composite stimulus remained flat. Figure 2 exemplarily shows the waveform of a stimulus in which the standard is a noise and the test is a RI sound with 16 iterations and a delay of 16 ms. Eight listeners participated in the first two experiments, where the test stimulus was a RI sound and the standard was a random noise. Nine listeners participated in the third experiment, six of whom had participated in the first two experiments; in the third experiment, the standard was a RI sound and the test sound was a noise. All listeners had normal audiological status and no history of neurological disease. Informed consent was obtained from each listener and the experimental procedures were approved by the Ethics Commission of the University of Münster.
Neuromagnetic recordings
The magnetic fields were recorded over the listener’s left hemisphere using a 37-channel first-order gradiometer system (Biomagnetic Technologies) in a magnetically shielded room. The data were acquired with a sampling rate of 297.6 Hz, filtered online between 0.1 and 100 Hz, and stored in 4-s stimulus-related epochs. The listeners were asked to stay awake and they were allowed to watch soundless video-films during the experiments.
Data analysis
The 100 data epochs acquired for each stimulus condition were averaged and lowpass filtered at 20 Hz using a zero-phase-shift filter. Epochs with amplitudes larger than 3 pT were considered artefactual and rejected. The sources of the N100m and the POR were analyzed with a single fixed dipole model assuming a spherical volume conductor. The center of the volume was estimated by approximating the scalp underneath the measuring coils by a sphere. Dipole parameters were derived using a maximum likelihood estimation procedure (Lütkenhöner, 1998a/b). The estimation of the time-invariant dipole parameters was restricted to a time window of 40 ms around the maximum in the root-mean-square (RMS) amplitude of the respective deflection. In order to analyze the N100m and P200m responses, the traces were baseline-corrected to the 100-ms period of silence just before stimulus onset. In the first and second experiments, the standard was always a noise, so the traces for all trials in each experiment were averaged, and the averaged traces analyzed to determine the location of the source. The baseline for the POR was the 100-ms segment of noise just before the transition to the RI sound. Sources were fitted separately for the POR in each stimulus condition, i.e., each combination of delay and number of iterations, because the latency of the POR depended on these parameters. Representative dipole parameters for the POR were produced by taking the median over the parameters for individual stimulus conditions. In one of the eight listeners who participated in the first two experiments, the signal-to-noise ratio of the responses was so low that many of the conditions did not yield a stable dipole solution, so this listener was discarded from further analysis.
Psychophysical pitch-discrimination experiment
psychophysical pitch-discrimination experiment was performed to measure the time required to form a stable estimate of the pitch of RI sounds and compare it to the latency of the POR. Four listeners with no history of hearing impairment or neurological disease participated in this experiment. The experiment was carried out in a sound-insulated room. The stimuli were RI sounds with 16 iterations and varying delays, d. They were gated on and off with 2.5-ms cosine-squared ramps and presented binaurally to the listeners through headphones (AKG K 240 DF). The pitch-discrimination threshold (PDT) was measured as a function of the duration of the RI sounds, using an adaptive two-alternative, forced-choice procedure. In each trial, two RI sounds were presented with a silent gap of 700 ms. The delays of the two RI sounds differed slightly and the listener had to indicate, which of the two sounds had the higher pitch, viz, the shorter delay. The duration and the mean delay of the two RI sounds were fixed throughout each threshold run. The delay difference between the two RI sounds was decreased by a factor, , after three consecutive correct responses and increased by the same factor after each incorrect response, tracking the delay difference that yields 79% correct responses (Levitt, 1971). The factor was 1.5 and 1.3 up to the first and second reversals of the delay difference and was reduced to 1.15 for the rest of the ten reversals that made up each threshold run. Each threshold estimate is the geometric mean of the delay differences at the last eight reversals. Three to five threshold estimates were gathered for each stimulus condition, that is, each combination of the mean delay and stimulus duration, and averaged. All stimuli were presented with a constant overall energy; when the stimulus duration was 512 ms, the intensity level was about 59 dB SPL. The shortest and the longest stimulus durations tested were 16 and 1024 ms corresponding to intensity levels of 74 and 56 dB, respectively.
RESULTS
The cortical response to the onset of pitch in a continuous sound
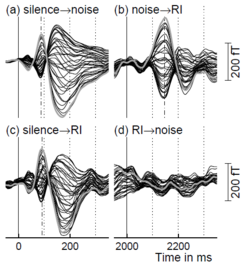
The main result of this study is illustrated in Fig. 3 for one representative listener. The left column shows the evoked magnetic fields at the onset of a noise (a) and a RI sound (c); the right column shows the response to the transition from one sound to the other at 2000 ms. The onset responses to the noise and RI sound (a and c) have essentially the same delay and amplitude, and the value of the delay is a little less than 100 ms (dash-dotted lines) indicating that these are classic N100m responses. The transition from noise to RI sound (b) produces an enhanced response, referred to as the ‘pitch-onset response’ (POR), with a much longer latency (about 150 ms). In contrast, the transition from RI sound to noise (d) produces no discernible response whatsoever, despite the fact that it produces a perceptual change that is just as salient.
The amplitude and latency of the pitch-onset response vary with the pitch and pitch strength
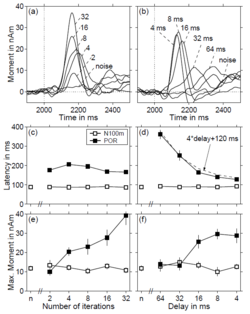
The amplitude and latency of the POR varied with the pitch and pitch strength of the RI sound. In the first experiment, the delay, d, was fixed at 16 ms, corresponding to a pitch of 62.5 Hz, and the number of iterations, n, was varied from 2 to 32 in doublings; in the second experiment, n was fixed at 16 and d was varied from 4 to 64 ms in octave steps. For each stimulus condition in each experiment, a single equivalent dipole model was used to estimate the size and location of the source of the magnetic field during the POR. The upper panels of Fig. 4 (a and b) show the average dipole moments for seven listeners plotted as a function of time relative to sound onset. Panel (a) shows that the number of iterations, which determines the salience of the pitch, has a large effect on the amplitude of the POR. Panel (b) shows that the delay, which determines the pitch, affects both the amplitude and the latency of the POR. The condition labeled ‘noise’ was a control, where the transition was from one sample of noise to another. As expected, this condition produced no discernable response. The latency and amplitude of the peak of the POR were determined for all of the dipole moment functions of each individual listener. The average latency values for the two experiments are presented by filled symbols in the middle panels of Fig. 4; the average amplitude values are presented by filled symbols in the lower panels. For a comparison, the open symbols show the latency and amplitude of the N100m response to the onset of noise in the respective stimulus condition, and in the noise control condition, labeled ‘n’ in each panel. Whereas, the number of iterations, n, has only a small effect on POR latency (c), the delay, d, has a pronounced effect on latency (d); it increases from about 130 ms when the delay is 4 ms to over 350 ms when the delay is 64 ms. The dashed line in (d) shows that the relationship is largely linear; the latency along the dashed line is four times the delay plus 120 ms. The amplitude of the POR also increases roughly linearly with each doubling in the number of iterations (e). The amplitude increases abruptly as the delay decreases from 32 to 16 ms (f). When the RI sound is high-pass filtered at 800 Hz, as in this experiment, the lower limit of pitch for this stimulus is between 16 and 32 ms (Krumbholz et al., 2000; Pressnitzer et al., 2001). When the delay is 32 or 64 ms, the temporal regularity is perceived as flutter or repetition of a non-descript noisy feature. This suggests that a prominent POR is associated with the presence of pitch. Closer examination of the latency data (d) indicates that there may be a discontinuity in the gradient of the latency-delay function in this region; the function is considerably steeper for delays greater than 16 ms. The statistical significance of the effects of number of iterations and delay on the latency and amplitude of the TR was verified by submitting the individual latency and amplitude data to a one-way ANOVA with repeated measures. Sheffé’s post hoc test showed that the significant (p < 0.0001) main effect of delay on the TR amplitude (Fig. 4f) was due to significant differences between the amplitudes for delays of 64 and 32 ms and those for 16, 8 and 4 ms (p 0.0036). The differences within each of these two groups were insignificant (p 0.6478). An analysis of covariance applied to the TR latencies for different delays confirmed that there was a significant difference between the gradients of the latency-delay function (Fig. 4d) for delays below and above 16 ms (p < 0.0001). In the third experiment, the standard segment of the stimulus was a RI sound with 16 iterations and a delay of 4, 8, or 16 ms, and the test sound was a random noise. None of the transitions from a RI sound to a noise produced a measurable transient response in any listener (see Fig. 3d).
The location of the source of the pitch-onset response
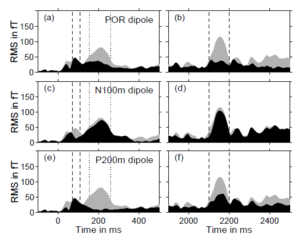
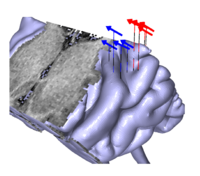
The presence of a strong magnetic response to the transition from noise to tone, and the absence of a response to the transition from tone to noise, suggest that the N100m and the POR are independent neural responses generated by largely different neural populations. This conjecture was supported by the analysis of the locations of the equivalent current dipoles for the N100m and the POR. On average, the POR dipole was 12.4 mm more anterior, 6.0 mm more medial and 10.9 mm inferior than the N100m dipole. The orientations of the POR and the N100m dipoles, on the other hand, were essentially equal. Each of the three Cartesian coordinates of the individual dipole locations for the N100m and the POR was submitted to a one-way ANOVA with repeated measures. The analysis showed that the anterior and inferior shifts of the POR dipole relative to the N100m dipole (12.4 and 10.9 mm) were both highly significant (p < 0.0001 and p = 0.0031); the medial shift (6.0 mm) was also significant, albeit with a slightly larger value of p (p = 0.0171). Figure 5 shows the proportion of the field explained by these current dipoles in two time ranges, one about the noise onset at 0 ms (left column), the other about the transition from noise to RI sound at 2000 ms (right column); the data are from one representative listener with an intermediate signal-to-noise ratio. The gray shading in Fig. 5 shows the root-mean-square (RMS) amplitude of the measured field from all 37 gradiometer channels. The black shading shows the RMS amplitude of the deviation of the measured field from the field predicted by the current dipole; for convenience, the RMS deviation will be referred to as the ‘residual’ field of the dipole. Panel (b) shows that the magnetic field (gray shading) in the time range associated with the POR, marked by vertical dashed lines, is much larger than the residual field of the POR dipole (black shading), indicating that the POR dipole produces a good fit to the field of the POR. Panel (a) shows that the same dipole does not provide a good fit to the N100m; between the vertical dashed lines, marking the time range for the N100m, the residual field is as large as the field itself. The situation is essentially reversed for the N100m dipole shown in the middle row of Fig. 5; the N100m dipole produces a good fit in the time range of the N100m response (between the dashed lines in panel c), and a poor fit in the time range of the POR (between the dashed lines in panel d). The response to the onset of sound energy is actually triphasic (peaks with inverted polarities at about 50, 100, and 200 ms; see Figs 3a and 3c). There is a large positive peak after the N100m, which is referred to as P200m. A pair of vertical dotted lines marks the time range for the P200m in the left column of Fig. 5; the residual field of the P200m dipole is shown in the bottom row of Fig. 5. The P200m dipole produces a good fit to the field in the region of the P200m (e), as would be expected. Moreover, the P200m dipole produces a relatively good fit to the POR (f), and the POR dipole produces a relatively good fit to the P200m (a). In contrast, the N100m dipole does not produce a good fit to either the P200m (c) or the POR (d). Taken together, these results suggest that the source of the POR is similar to that of the P200m, and they both differ from the source of the N100m. Lütkenhöner and Steinsträter (1998) performed a high-precision measurement of the source locations of the N100m and P200m responses in a single listener, using sinusoids with varying frequencies as stimuli; the sources were then coregistered with a three-dimensional reconstruction of the listener’s auditory cortex. Their results suggest that the N100m arises from planum temporale, whereas the source of the P200m is located on Heschl’s gyrus, anterior and inferior to the source of N100m. In order to determine whether the same is true for the POR, additional measurements were obtained from a listener with a large signal-to-noise ratio. The standard segment of the stimulus was a noise and the test segment was a RI sound with an 8-ms delay and 16 iterations that produces a strong pitch and thus a large POR. Four separate measurement sessions were performed, during each of which the stimulus was presented 420 times. Figure 6 shows a three-dimensional reconstruction of the listener’s left temporal lobe derived from magnetic resonance images. The vertical lines with red arrows show the equivalent current dipoles for the N100m from the four measurement sessions; the vertical lines with blue arrows show the comparable dipoles for the POR. Despite the variability, it is clear that the POR dipoles are anterior and inferior to the N100m dipoles. The location of the N100m dipoles is consistent with Lütkenhöner and Steinsträter’s assumption that the N100m arises from planum temporale. The location of the POR dipoles appears to be on Heschl’s gyrus in a position similar to the location that Lütkenhöner and Steinsträter reported for the P200m.
The latency of the pitch-onset response and the perceptual integration time for pitch
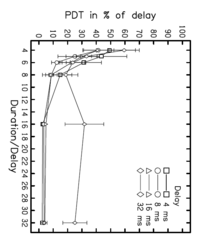
The results from the previous sections indicate that the POR reflects the activity of those neural elements in auditory cortex that involved in pitch processing. The function relating POR latency to the delay of the RI sound (Fig. 4d) shows that the neural elements at the source of the POR integrate pitch-related information over about four times the delay before generating a response. The functional imaging data of Griffiths et al. (2001) show that the processing of temporal pitch information is organized hierarchically in the auditory system. In this section, we report a psychophysical experiment designed to measure the perceptual integration time for pitch, that is, the time required to form a stable pitch estimate. The purpose was to try and determine the point in the pitch hierarchy represented by the POR by comparing the latency of the POR to the perceptual integration time for pitch. In the experiment, listeners were required to indicate which of two RI sounds had the higher pitch, and ‘pitch discrimination threshold’ (PDT) was defined to be the minimum difference in delay required for statistically reliable discrimination. For each of four different delays of the RI sounds, ranging from 4 to 32 ms in octave steps, the PDT was measured as a function of stimulus duration. The data are presented in Fig. 7; the parameter is the delay. The figure shows that threshold decreases rapidly as duration increases from about 4 to 8 times the delay of the RI sound. When the sounds were shorter than four times the delay, it was not possible to measure a stable threshold. This suggests that the auditory system has to integrate over a duration of at least four times the delay to derive a rough estimate of the pitch for these sounds – a period that is comparable to the POR latency. At the same time, the auditory system appears to be able to integrate over a period of up to eight times the delay to attain a more precise pitch estimate. Beyond eight times the delay, the PDT asymptotes and the value of the asymptote is considerably lower for the 4-, 8- and 16-ms delays than it is for the 32-ms delay. This is probably because a RI sound with a 32-ms delay does not produce a precise pitch when filtered as in the current experiment (Krumbholz et al., 2000).
DISCUSSION
The present study describes a transient neuromagnetic response, referred to as the pitch-onset response (POR), which can be elicited by the transition from a noise to a tone even when there is no concurrent change in sound energy. The transition from a tone to a noise, on the other hand, produces no discernable transient response, despite the fact that it is perceptually just as salient. This suggests that the cortical generators of the POR are associated with the neural processing of pitch-related information in sounds. This notion is corroborated by the finding that the latency and amplitude of the POR vary with the pitch and the pitch strength of the tone. In contrast, the N100m responses to the onset of a tone and to the onset a noise may have essentially the same shape (see Figs 3a and 3c). Together with the fact that the location of the source of the POR differs from that of the N100m, this suggests that the neural generators of the POR and the N100m are functionally independent. The comparison of the physiological and perceptual data suggests that the neural elements at the source of the POR are involved in extracting an initial estimate of the pitch of a sound. The latency of the POR corresponds to the time that is required to determine that the sound has a unique pitch. At the same time, the POR occurs prior to the time required to refine the pitch value to the point where it could be used for melodic pitch perception (Krumbholz et al., 2000; Pressnitzer et al., 2001). The POR seems to represent a source, or sources, on medial Heschl’s gyrus, adjacent to a larger region in the anterolateral half of Heschl’s gyrus where functional imaging studies have shown that activation is highly correlated with the degree of regularity in RI sounds (Griffiths et al., 1998, 2001). In addition, a recent MEG study (Gutschalk et al., 2002) with click trains has shown that regular click trains produce much more activity than irregular click trains with the same average click rate in medial Heschl’s gyrus. With regard to the hierarchy of pitch processing, this suggests that pitch is extracted and refined in centers progressing laterally along Heschl’s gyrus and on into adjacent areas.
REFERENCES
Bilsen, F.A. (1966). Repetition pitch: Monaural Interaction of a sound with the repetition of the same, but phase-shifted sound. Acustica 17, 295-300.
Crottaz-Herbette S., Ragot R. (2000). Perception of complex sounds: N1 latency codes pitch and topography codes spectra. Clin. Neurophysiol. 111, 1759-1766.
Forss N., Mäkelä J.P., McEvoy L., Hari R. (1993). Temporal integration and oscillatory responses of the human auditory cortex revealed by evoked magnetic fields to click trains. Hear. Res. 68, 89-96.
Griffiths T.D., Buchel C., Frackowiak R.S., Patterson R.D. (1998). Analysis of temporal structure in sound by the human brain. Nat. Neurosci. 1, 422-427.
Griffiths T.D., Uppenkamp S., Johnsrude I., Josephs O., Patterson R.D. (2001). Encoding of the temporal regularity of sound in the human brainstem. Nat. Neurosci. 4, 633-637.
Gutschalk A., Patterson R. D., Rupp A., Uppenkamp S., Scherg M. (2002). Sustained magnetic fields reveal separate sites for sound level and temporal regularity in human auditory cortex. Neuroimage 15, 207-216.
Krumbholz, K., Patterson, R. D., Pressnitzer, D. (2000). The lower limit of pitch as determined by rate discrimination. J. Acoust. Soc. Am. 108, 1170-1180.
Langner G., Sams M., Heil P., Schulze H. (1997). Frequency and periodicity are represented in orthogonal maps in the human auditory cortex: Evidence from magnetoencephalography. J. Comp. Physiol. [A] 181, 665-676.
Lütkenhöner B. (1998a). Dipole source localization by means of maximum likelihood estimation: I. Theory and simulations. Electroenceph. clin. Neurophysiol. 106, 314-321.
Lütkenhöner B. (1998b). Dipole source localization by means of maximum likelihood estimation: II. Experimental evaluation. Electroenceph. clin. Neurophysiol. 106, 322-329.
Lütkenhöner B., Steinsträter O. (1998). High-precision neuromagnetic study of the functional organization of the human auditory cortex. Audiol. Neurootol. 3, 191-213.
Lütkenhöner B., Lammertmann C., Knecht S. (2001). Latency of auditory evoked field deflection N100m ruled by pitch or spectrum? Audiol. Neurootol. 6, 263-278.
Näätänen R, Picton T. (1987). The N1 wave of the human electric and magnetic response to sound: a review and an analysis of the component structure. Psychophysiology 24, 375-425.
Pantev C., Hoke M., Lütkenhöner B., Lehnertz K. (1989). Tonotopic organization of the auditory cortex: pitch versus frequency representation. Science 246, 486-488.
Pantev C., Elbert T., Ross B., Eulitz C., Terhardt E. (1996). Binaural fusion and the representation of virtual pitch in the human auditory cortex. Hear. Res. 100, 164-170.
Pantev C., Oostenveld, R., Engelien, A., Ross, B., Roberts, L.E., and Hoke, M. (1998). Increased cortical representations of musicians. Nature 392, 811-814.
Patterson, R.D., Allerhand, M., Giguère, C. (1995). Time-domain modeling of peripheral auditory processing: A modular architecture and a software platform. J. Acoust. Soc. Am. 98, 1890-1894.
Pressnitzer, D., Patterson, R. D., Krumbholz, K. (2001). The lower limit of melodic pitch. J. Acoust. Soc. Am. 109, 2074-2084. Yost W.A. (1996). Pitch strength of iterated rippled noise. J. Acoust. Soc. Am. 100, 3329-3335.
ACKNOWLEDGEMENTS
Research supported by the Deutsche Forschungsgemeinschaft (Lu342/4-2), the UK Medical Research Council (G9901257) and the Austrian Academy of Sciences (APART 524).

