File:KPSPLLcc03 fig4.PNG
From CNBH Acoustic Scale Wiki
Size of this preview: 477 × 600 pixels
Full resolution (648 × 815 pixels, file size: 70 KB, MIME type: image/png)
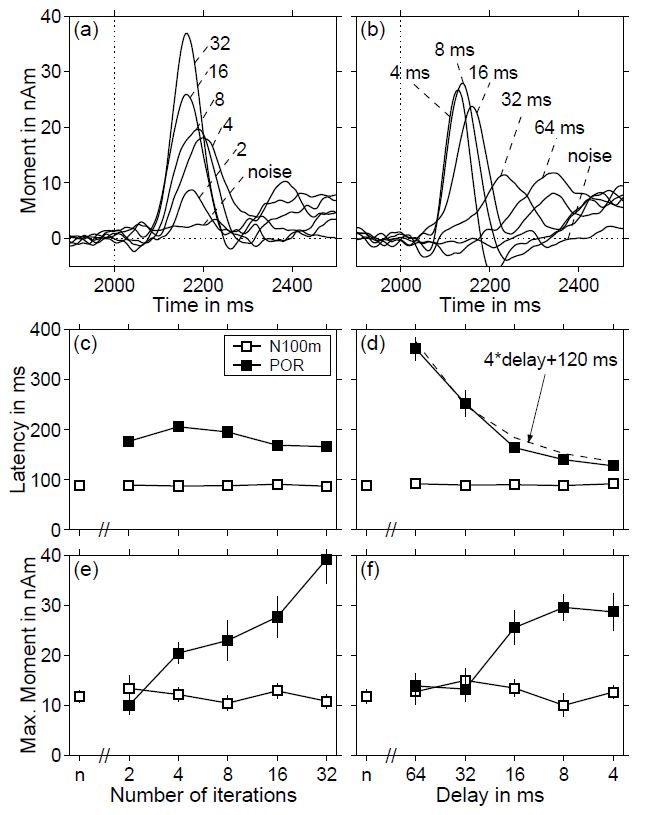
Fig.4: Upper panels: Average dipole moments as a function of time in response to the transition from a noise to a regular-interval sound, when the delay was fixed at 16 ms and the number of iterations was varied from 2 to 32 (a), when the number of iterations was fixed and the delay was varied from 4 to 64 ms (b). The condition labeled ‘noise’ was a control, where the transition was from one sample of noise to another. The dipole moment is plotted as a function of time relative to stimulus onset, the transition from noise to RI was at 2000 ms. Middle and lower panels: The filled symbols show the latency (c, d) and amplitude (e, f) of the POR as a function of the number of iterations (c, e) and the delay (d, f) of the RI sound. For comparison, the open symbols show the latency and amplitude of the N100m response to the onset of noise in the respective stimulus condition, and in the noise control condition, labeled ‘n’ in each panel. The small vertical lines show the standard error of the mean and in many cases they are smaller than the size of the symbol. The dashed line in panel (d) represents an empirical description of the POR latency, given by 120 ms plus four times the delay of the RI sound.
File history
Click on a date/time to view the file as it appeared at that time.
| Date/Time | Thumbnail | Dimensions | User | Comment | |
|---|---|---|---|---|---|
| current | 10:49, 10 September 2008 | | 648×815 (70 KB) | AlessandroB (Talk | contribs) |
- Edit this file using an external application (See the setup instructions for more information)
File links
The following page links to this file: