File:KPSPLLcc03 fig3.PNG
From CNBH Acoustic Scale Wiki
No higher resolution available.
KPSPLLcc03_fig3.PNG (496 × 528 pixels, file size: 69 KB, MIME type: image/png)
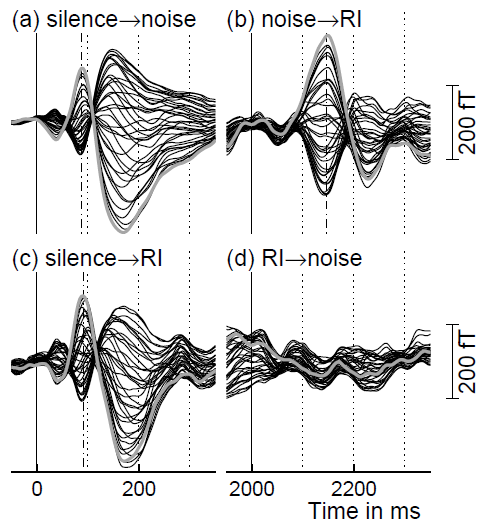
Fig.3: Neuromagnetic fields evoked by the onset of a noise (a) and a RI sound (c) at 0 ms, and by the transition from a noise to a RI sound (b) and from a RI sound to a noise (d) at 2000 ms. The RI sound had a delay of 8 ms and 16 iterations of the delay-and-add process, so it produced a strong pitch at 125 Hz which is just below the note ‘C’ one octave below ‘middle C’ on the piano keyboard. The data are from one representative listener. Each panel shows a compilation of the 37 measurement channels, averaged over 100 presentations of the respective stimulus. The data were lowpass filtered at 20 Hz, and baseline corrected to the 100-ms period of silence just before the onset of the standard at 0 ms. The POR had the same polarity as the N100m as illustrated by the gray line in panels (a) and (b) which highlights one specific channel.
File history
Click on a date/time to view the file as it appeared at that time.
| Date/Time | Thumbnail | Dimensions | User | Comment | |
|---|---|---|---|---|---|
| current | 10:47, 10 September 2008 | | 496×528 (69 KB) | AlessandroB (Talk | contribs) |
- Edit this file using an external application (See the setup instructions for more information)
File links
The following 2 pages link to this file: