File:KPSPLLcc03 fig7.PNG
From CNBH Acoustic Scale Wiki
Size of this preview: 505 × 600 pixels
Full resolution (581 × 690 pixels, file size: 35 KB, MIME type: image/png)
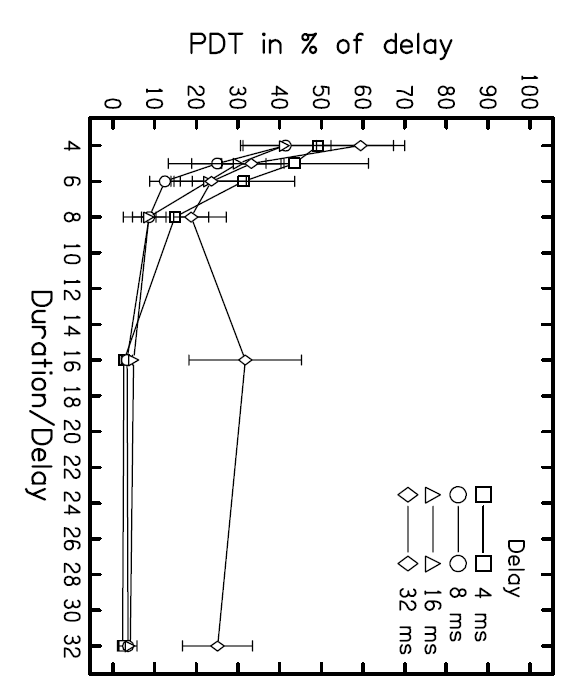
Fig.7: Average pitch discrimination threshold (PDT) for RI sounds with delays of 4, 8, 16 and 32 ms, plotted as a function of the normalized duration of the stimuli, that is, duration divided by the respective delay. The PDT is the difference between the two delays at threshold expressed as a percentage of the geometric mean of the delays. The data points show the average PDT of four listeners and the error bars show the standard error of the mean. The RI sounds were generated with 16 iterations of the delay-and-add process
File history
Click on a date/time to view the file as it appeared at that time.
| Date/Time | Thumbnail | Dimensions | User | Comment | |
|---|---|---|---|---|---|
| current | 10:55, 10 September 2008 | | 581×690 (35 KB) | AlessandroB (Talk | contribs) |
- Edit this file using an external application (See the setup instructions for more information)
File links
The following page links to this file: