File:KPSPLLcc03 fig5.PNG
From CNBH Acoustic Scale Wiki
No higher resolution available.
KPSPLLcc03_fig5.PNG (549 × 440 pixels, file size: 32 KB, MIME type: image/png)
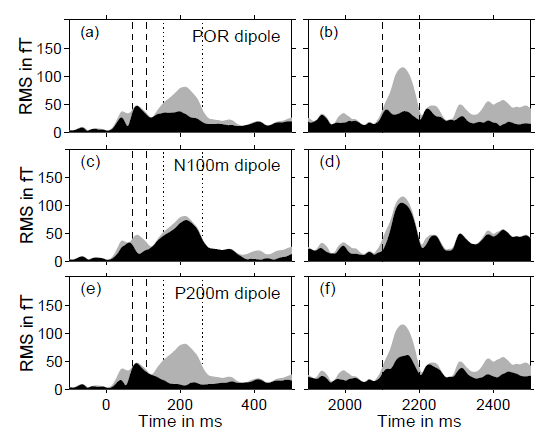
Fig. 5: Proportion of the measured field that can be explained by three separate dipoles in two 600-ms time ranges, one about the noise onset at 0 ms (left column), the other about the transition from noise to RI sound at 2000 ms (right column). The data are from one representative listener with an intermediate signal-to-noise ratio. The gray shading shows the root-mean-square (RMS) amplitude of the measured field. The black areas show the RMS amplitude of the deviation between the measured field and the fields predicted by the POR dipole (a, b), the N100m dipole (c, d) and the P200m dipole (e, f). The latency ranges for the N100m and the POR are marked by pairs of vertical dashed lines; the latency range for the P200m is marked by a pair of dotted lines.
File history
Click on a date/time to view the file as it appeared at that time.
| Date/Time | Thumbnail | Dimensions | User | Comment | |
|---|---|---|---|---|---|
| current | 10:52, 10 September 2008 | | 549×440 (32 KB) | AlessandroB (Talk | contribs) |
- Edit this file using an external application (See the setup instructions for more information)
File links
The following page links to this file: