Separating Pitch Chroma and Pitch Height in the Human Brain
From CNBH Acoustic Scale Wiki
Musicians recognize pitch as having two dimensions. On the keyboard, these are illustrated by the octave and the cycle of notes within the octave. In perception, these dimensions are referred to as pitch height and pitch chroma respectively. Pitch chroma provides a basis for presenting acoustic patterns (melodies) that do not depend on the particular sound source. In contrast, pitch height provides a basis for segregation of notes into streams to separate sound sources. This paper reports a functional magnetic resonance experiment designed to search for distinct mappings of these two types of pitch change in the human brain. The results show that chroma change is specifically represented anterior to primary auditory cortex, while height change is specifically represented posterior to primary auditory cortex. We propose that tracking of acoustic information streams occurs in anterior auditory areas, while the segregation of sound objects (a crucial aspect of auditory scene analysis) depends on posterior areas.
Contents |
INTRODUCTION
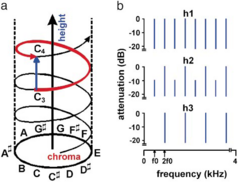
Auditory scientists define pitch as the perceptual correlate of acoustic frequency: a single physical dimension along which musical notes can be ordered from low to high (1). However, humans perceive the notes of the scale as repeating once per octave: accordingly, music psychologists represent pitch as a helix (Figure 1a) with a circular dimension of pitch chroma and a vertical dimension of pitch height (2-5). The function of these two pitch dimensions is illustrated when the same melody is sung by a male or a female voice, or played by a violin or a cello. The vocal cords of women vibrate faster than those of men, and the strings of a violin vibrate faster than those of a cello. These physical differences correspond to differences in pitch height that contribute to our perception that women’s voices are higher than men’s and violins are higher than cellos. Note that this is distinction is not based on pitch chroma, since both voices or instruments can produce the full range of chromas; it is an average pitch height difference that is more properly associated with the perception that one source is higher than another. Whereas pitch chroma is used in tracking the information conveyed by a particular sound source, pitch height is used in the segregation of sources. This study describes a functional magnetic resonance imaging (fMRI) experiment designed to establish whether separate mechanisms for processing the two pitch dimensions exist in the human brain. Previous human fMRI experiments have shown that pitch information is processed in regions beyond primary auditory cortex (PAC). PAC is located in the medial portion of Heschl’s gyrus (HG) (6); musical melodies (7-9) and speech information (10,11) activate areas that are lateral and anterior to PAC. Other functional imaging experiments indicate that the human planum temporale (PT) (12) posterior to HG is involved in auditory object segregation (13). However, the chroma and height dimensions of pitch have not been separated in previous functional imaging studies. We therefore designed the present fMRI experiment to determine whether the helical model of pitch perception is reflected in the organization of the human brain. We tested the specific hypothesis that pitch chroma changes (auditory information streams) are processed in anterior auditory regions and pitch height changes (changes in sound source identity) are processed in posterior auditory regions.
METHODS
Bases for the manipulation of pitch dimensions
In this experiment, we used stimuli in which pitch chroma and pitch height could be varied independently. The stimuli were harmonic complexes in which chroma and height could be varied continuously while the total energy and spectral region remained fixed (Figure 1b; examples available as Supporting Information on-line) (14,15). The standard stimulus with all harmonics of the fundamental frequency, f0 (Figure 1b, top row) had the pitch f0, by definition. The pitch chroma of the stimuli was altered by varying f0 in semitone steps as in the chromatic musical scale; this corresponds to motion around the pitch helix (the red line in Figure 1a). The pitch height was varied independently of chroma by reducing the amplitude of all odd harmonics in the complex (Figure 1b, middle row). If the odd harmonics of a harmonic complex are attenuated between 0 and approximately 40 dB, relative to baseline intensity, the new tone has the same pitch chroma, f0, but is perceived as higher in pitch;: this change occurs along the pitch height dimension (blue line in Figure 1a). When the odd harmonics are attenuated completely pitch height reaches the octave, 2f0 (Figure 1b, bottom row), and repeating the attenuation process over successive octaves produces continuous pitch height changes without concomitant chroma changes. Using this procedure, we were able to synthesize sequences of notes in which chroma and/or height could be independently varied between notes in the sequence (examples available as Supporting Information on-line)
Relationship between pitch height, tone height and timbre
There are at least three methods for producing a sequence of harmonic sounds which all have the same pitch chroma but which are heard to ‘rise’ along a perceptual dimension as the sequence progresses (14). The ‘rise’ can be achieved by varying the spectral envelope of the sounds, or by changing the spectral fine structure (either the intensity or the phase of alternate harmonics). Such manipulations are all related to the type of ‘increase’ one hears when the speaker changes from a man to a woman, or the instrument changes from a cello to a violin. All three manipulations have been described as producing an increase in ‘tone height’. Here, we consider ‘tone height’ in a more restricted sense to refer to manipulation of the spectral envelope, which is more closely associated with timbre perception. In contrast, we use ‘pitch height’ in this experiment to refer to a manipulation of spectral fine structure that is more closely associated with pitch perception.
Tone height manipulations associated with timbre are related to the size information in natural sounds (16). Women have shorter vocal tracts than men and, as a result, their formant frequencies are higher. Violins are smaller than cellos and, as a result, their resonant peaks occur at higher frequencies. The important point is that these tone height manipulations are associated with a dimension of timbre perception that is separate from pitch height, and the manipulations in the current experiments do not involve tone height in this sense. Pitch height manipulations are also related to the size information in natural sounds. These manipulations involve attenuation of the odd harmonics, as described above, or a fixed shift in the phase of either the odd or the even harmonics. The phase manipulations are noteworthy inasmuch as they have no effect on the power spectrum of the stimulus, but they still produce a rise the perceived pitch (14). This report is primarily concerned with the perception of pitch height rather than tone height, and the location of pitch height processing rather than tone height processing in auditory cortex.
It is the case that manipulation of the fine spectral structure of sounds can also affect the timbre of a sound. For example, the characteristic timbre of a clarinet is partly due to the fact that the even harmonics are attenuated relative to the odd harmonics, and this imparts a characteristic ‘hollowness’ to the sound. In the current experiment, however, it was the odd harmonics that were attenuated (relative to the even harmonics) and this has much less effect on the timbre of the sound. In summary, the manipulation of the spectrotemporal structure of the stimulus can have two perceptual effects, but it is the effect on pitch height that is the focus of the current paper: in the next section, we demonstrate ordering effects that are most parsimoniously explained in terms of a pitch dimension.
Psychophysical effect of pitch height manipulation
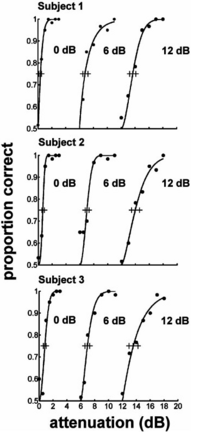
The effect of attenuating the odd components of a harmonic series on the pitch height of the sound was originally investigated in a scaling experiment (14,15). We performed a new pitch height discrimination experiment to confirm that the stimulus manipulations used in the present study could be ordered continuously along the dimension of pitch height and to determine the resolution of discrimination along this dimension. In a two-interval-two-alternative-forced-choice task, three normal subjects were presented with a standard stimulus and a test stimulus in which the odd harmonics were attenuated more than the standard: the task was to choose the stimulus with the higher pitch height. Notes all had the same pitch chroma (80 Hz), duration (200 ms), frequency region (f0 to 4 kHz) and energy (sound pressure level 70 dB). Three different ‘standard’ stimuli were used for each listener where the odd harmonics had fixed attenuation of 0, 6 or 12 dB. The results are presented in Figure 2. The left-hand psychometric functions show how discrimination increased with attenuation for the standard with 0 dB attenuation of the odd harmonics. All three listeners had thresholds of less than 1 dB of attenuation, and achieved near-ceiling performance at just over 2 dB of attenuation. The central and right-hand psychometric functions show that pitch height discrimination remained excellent and essentially uniform when the standard stimulus had fixed attenuation of odd harmonics by 6 or 12 dB. The experiment was performed without feedback and required essentially no training, indicating that the pitch height cue is stable and the direction of ‘higher’ is consistent across listeners.
Stimulus details
. In the fMRI experiment, sounds were either pitch-producing harmonic complexes or broadband Gaussian noise (Figure 1b; examples available as Supporting Information on-line). All stimuli were created digitally at a sampling rate of 44.1 kHz. Total energy and passband (0 to 4kHz) were fixed for all stimuli. All sound sequences were eight seconds in duration; each sequence was composed of 40 individual sounds, each 200 ms in duration. The harmonic complexes were in cosine phase with components ranging from f0 to 4 kHz (Figure 1b). Pitch chroma was varied randomly across one octave (60 – 120 Hz) of the chromatic musical scale by varying f0 from note to note in the sequence, in semitone steps. Pitch height was also varied randomly across approximately one octave, by attenuating the amplitude of all odd harmonics (Figure 1b, middle row) from note to note, in 2 dB steps. The note with the lowest pitch height had fundamental f0 with 10 dB attenuation of the odd harmonics of f0; the note with the highest pitch height had fundamental 2f0 with 10 dB attenuation of the odd harmonics of 2f0. The intervening pitch height steps had 12, 14, 16, 18 and 20 dB attenuation of the odd harmonics of f0, and 0, 2, 4, 6 and 8 dB attenuation of the odd harmonics of 2f0. In the stimuli with changing pitch height, chroma values were lowered by half an octave. The total range of subjective pitch change across a sequence was therefore approximately one octave with either chroma variation or height variation, and the maximum overall pitch range was one and a half octaves if both chroma and height variation occurred together. Stimulus parameters in the psychophysics experiment were identical to those used in the fMRI experiment.
Scanning protocol
Ten subjects aged 21 to 38 (six males, four females; nine right-handed, one left-handed) participated in the fMRI experiment. None had any history of hearing or neurological disorder and all had normal structural MRI scans. All subjects gave informed consent and the experiment was carried out with the approval of the local Ethics Committee. Prior to scanning, subjects were asked to pay attention to the sound sequences; to help maintain alertness, they were required to make a single button press at the end of each broadband noise sequence using a button box positioned beneath the right hand, and to fixate a cross in the middle of the visual field. There was no active auditory discrimination task. During scanning, six stimulus conditions were used, corresponding to six types of sound sequence: 1) fixed pitch chroma, fixed pitch height; 2) changing pitch chroma, fixed pitch height; 3) changing pitch height, fixed pitch chroma; 4) changing pitch chroma, changing pitch height; 5) broadband noise without pitch; 6) silence. The order of conditions was randomized. Stimuli were delivered using a custom electrostatic system (http://www.ihr.mrc.ac.uk/caf/soundsystem/index.html) at a sound pressure level of 70 dB. Each sound sequence was presented for a period of eight seconds, after which brain activity was estimated by the fMRI blood-oxygen-level-dependent (BOLD) response at 2 Tesla (Siemens Vision, Erlangen) using gradient echo planar imaging in a sparse acquisition protocol (TR/TE = 12000/40 ms) (19). 192 brain volumes were acquired for each subject (32 volumes for each condition) in two sessions. Each brain volume comprised 48 contiguous 4 mm transverse slices with an in-plane resolution of 3 mm by 3 mm.
Following scanning, all subjects underwent two-alternative forced choice psychophysics to determine thresholds for detection of chroma and height changes in the sound sequences used during image acquisition. During scanning, the minimum pitch chroma and pitch height steps were 1 semitone and 2 dB, respectively. All subjects in the fMRI experiment could readily detect the changes in pitch chroma and pitch height, and distinguish chroma sequences and height sequences: all had a threshold for detection of pitch chroma change less than 1 semitone, and a threshold for pitch height change less than 2 dB. The sound sequences with changing pitch height were perceived by subjects as a disrupted auditory stream.
Image analysis
A group analysis for all subjects was carried out using statistical parametric mapping implemented in SPM99 software (http//:www.fil.ion.ucl.ac.uk/spm). Scans were first realigned and spatially normalized (20) to the MNI standard stereotactic space (21). Data were spatially smoothed with an isotropic Gaussian kernel of 8 mm full width at half maximum. Statistical parametric maps were generated by modelling the evoked hemodynamic response for the different stimuli as boxcars convolved with a synthetic hemodynamic response function in the context of the general linear model. A fixed effects model was used to assess differences in blood flow between conditions of interest (i.e., areas in which pitch chroma change and pitch height change produced additional activation to that produced by the fixed chroma and fixed height baseline conditions). The t statistic was estimated for each voxel at a significance threshold of p < 0.05 after correction for multiple comparisons across the whole brain volume according to Gaussian random field theory. Individual analyses were also carried out for each subject using the same preprocessing parameters and statistical model, and assessed using a significance threshold of p < 0.05 after small volume correction taking the a priori anatomical hypotheses into account. For the contrast between changing and fixed chroma conditions, anatomical small volumes were derived from the group mean structural MRI brain; these small volumes comprised left and right lateral HG and PP. For the contrast between changing and fixed height conditions, anatomical small volumes were based on 95% probability maps for the left and right human PT (12).
RESULTS
Group analysis
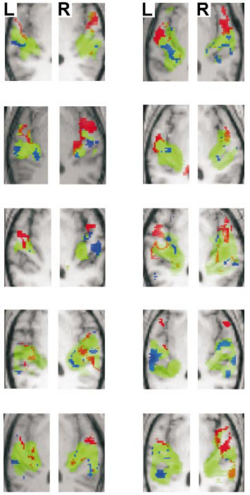
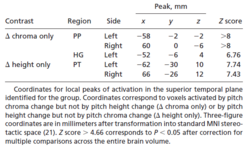
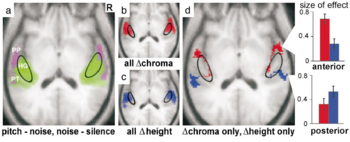
In the group analysis, significant activation was demonstrated in each of the contrasts of interest at the p < 0.05 voxel level of significance after correction for multiple comparisons across the entire brain volume. The contrast between broadband noise and silence produced extensive, bilateral, superior temporal activation including medial HG and parts of PT (Figure 3a, green) that was largely symmetric. The contrast between pitch conditions and noise produced more restricted, bilateral, activation in the lateral part of HG and PT and extending into PP (Figure 3a, lilac). The contrast between changing and fixed pitch chroma (Figure 3b, red) and the contrast between changing and fixed pitch height (Figure 3c, blue) produced common, bilateral activation in lateral HG and antero-lateral PT. Masking was then applied to exclude voxels activated both by change in pitch chroma and by change in pitch height (Figure 3d). Brain areas activated only by changes in pitch chroma were distinct from those activated only by changes in pitch height: pitch chroma change (Figure 3d, red) produced additional activation extending anteriorly from HG into PP, whereas pitch height change (Figure 3d, blue) produced additional activation extending posteriorly in PT. Activation was bilateral and slightly asymmetric; the activity in the right hemisphere was slightly more anterior than that in the left hemisphere. Local maxima of activation in the superior temporal plane for the group are listed in Table 1. The relative magnitude of the mean size of effect (change in BOLD signal) in each of the contrasts of interest (Figure 3d, right) shows the opposite pattern for pitch chroma and pitch height processing in anterior and posterior auditory areas.
Individual analyses
Individual subject analyses were carried out to determine whether the anatomical distinction between the regions specific for pitch chroma and height processing in the group was also evident in the individual data. Figure 4 presents the individual results for the same axial slice as in Figure 3: the pattern of activation in individuals was very similar to that of the group. An analysis was performed using anatomical volumes of interest for lateral HG, PP and PT specified a priori (see Methods). As in the group analysis, voxels activated both by pitch chroma change and by pitch height change were exclusively masked to identify voxels specifically activated by pitch chroma change or by pitch height change. There was significant activation in each contrast in all subjects at the p < 0.05 voxel level of significance after correction for the specified volume. For pitch chroma change, significant local maxima occurred in the prespecified volume involving lateral HG and PP in every subject. For pitch height change, local maxima occurred in the prespecified volume involving PT in every subject. Coordinates of local maxima for all individuals are provided in a Supplementary Table, available on-line.
DISCUSSION
In this paper, we have presented new psychophysical evidence to support the view that pitch has two distinct dimensions: pitch chroma and pitch height. When chroma is kept constant, pitch height can be manipulated and ordered from low to high along a continuous dimension. We have shown that the dimensions of pitch chroma and height have distinct representations in human auditory cortex. These representations occur at a logical point in the recently proposed hierarchy of melody processing (8,9). Medial HG (PAC) is activated similarly when processing noise or pitch. Lateral HG (secondary auditory cortex) shows an increase in activity when processing pitch (Figures 3 and 4) and it is activated both by changing pitch chroma and by changing pitch height. Areas specifically activated by chroma change exist anterior to HG within PP, while areas specifically activated by height change exist posterior to HG within PT. The analysis of pitch variation in sound sequences extending over seconds is required to process melodies in music and prosody in speech, and it has previously been shown to involve bilateral auditory areas anterior and posterior to HG (8,9). However, these previous studies did not manipulate the two dimensions of pitch separately, and did not address the possibility that distinct brain mechanisms exist for the processing of pitch chroma and height. The pitch height changes in the present experiment were perceived by subjects as a disrupted auditory stream; here, pitch height provided a non-spatial cue for the segregation of sound objects at an early stage in auditory source analysis (22). Previous work showing activation in PT where spatial cues were the basis for segregation can be interpreted in a similar way (23). A specific mechanism for pitch height processing in PT is therefore in accord with a recently proposed model in which this area plays a critical early role in the segregation of sound objects in the acoustic environment (13). In contrast, specific activation of PP anterior to HG by stimuli with changing chroma supports previous work on melody (7-9) and speech (10,11) processing: activation of anterior auditory areas would afford a mechanism for tracking pitch chroma patterns that form coherent information streams which can be analysed independently of the specific sound source. The anatomical and functional organization of the cortical auditory system in both humans and nonhuman primates is controversial (24,25). In non-human primates, anatomical and electrophysiological evidence (26-28) suggests distinct ‘what’ and ‘where’ streams of processing beyond PAC, passing anteriorly and posteriorly respectively. However, a proportion of neurons in the macaque posterior temporal lobe demonstrate responses to particular call sounds (28). In humans, functional imaging (29-31) and lesion (32) data support a dual organization beyond PAC, however both the extent and the functional basis of any separation of processing mechanisms have been disputed (23-25). The present human study has demonstrated that mechanisms for analysing pitch chroma patterns exist in the anterior temporal lobe, while mechanisms for analysing pitch height exist in the posterior temporal lobe. If, as we hypothesize, pitch height differences are involved in the initial stages of auditory scene analysis, then it would seem reasonable to propose that in the human auditory brain, anterior cortical areas are engaged in processing patterns of information from one sound source, whereas posterior cortical areas are engaged in the segregation of sound sources in the environment.
ACKNOWLEDGEMENTS
This work was supported by the Wellcome Trust (JDW and TDG) and by UK Medical Research Council Grant G9901257 (SU and RDP).
REFERENCES
1. American Standards Association (1960) American Standards Association (New York).
2. Donkin, F. (1874) Acoustics (Oxford University Press).
3. Pikler, A. (1966) J. Acoust. Soc. Am. 39, 1102-1110.
4. Shepard, R.N. (1982) in The Psychology of Music, ed. Deutsch, D. (Academic, New York, ed. 1), pp. 344-390.
5. Krumhansl, C.L. (1990) Cognitive Foundations of Musical Pitch (Oxford Univ. Press, New York), pp. 112-114.
6. Rademacher, J., Morosan, P., Schormann, T., Schleicher, A., Werner, C., Freund, H.J., & Zilles, K. (2001) NeuroImage 13, 669-683.
7. Zatorre, R.J., Evans, A.C. & Meyer, E. (1994) J. Neurosci. 14, 1908-1919.
8. Griffiths, T.D., Büchel, C., Frackowiak, R.S.J. & Patterson, R.D. (1998) Nature Neurosci. 1, 422-427.
9. Patterson, R. D., Uppenkamp, S., Johnsrude, I., & Griffiths, T.D. (2001) Neuron 36, 767-776.
10. Binder, J.R. (2000) Brain 123, 2371-2372.
11. Scott, S.K., Blank, C.C. & Wise, R.J.S. (2000) Brain 123, 2400-2406.
12. Westbury, C.F., Zatorre, R.J. & Evans, A.C. (1999) Cereb. Cortex 9, 392-405.
13. Griffiths, T.D. & Warren, J.D. (2002) Trends Neurosci. 25, 348-353.
14. Patterson, R.D. (1990) Mus. Percept. 8, 203-214.
15. Patterson, R.D., Milroy, R. & Allerhand, M. (1993) Contemp. Mus. Rev. 9, 69-81.
16. Irino, T. & Patterson, R. D. (2002) Speech Communication 36, 181-203.
17. Wichmann, F.A. & Hill, N.J. (2001) Perception Psychophysics 63, 1293-1313.
18. Wichmann, F.A. & Hill, N.J. (2001) Perception Psychophysics 63, 1314-1329.
19. Hall, D.A., Haggard M.P. & Akeroyd, M.A. (1999) Hum. Brain Mapp. 7, 213-223.
20. Friston, K.J., Ashburner, J., Frith, C.D., Poline, J.B., Heather, J.D. & Frackowiak, R.S.J. (1995) Hum. Brain Mapp. 2, 165-189.
21. Evans, A.C., Collins, D.L., Mills, S.R., Brown, R.D., Kelly, R.L. & Peters, T.M. (1993) IEEE Nucl. Sci. Symp. Med. Imag. Conf. Proc. IEEE, 108, 1877-1878.
22. Bregman, A.S. (1990) Auditory Scene Analysis (MIT Press).
23. Zatorre, R.J., Bouffard, M., Ahad, P. & Belin, P. (2002) Nature Neurosci. 5, 905-909.
24. Belin, P. & Zatorre, R.J. (2000) Nature Neurosci. 3, 965–966.
25. Romanski, L.M., Tian, B., Fritz, J.B., Mishkin, M., Goldman-Rakic, P.S. & Rauschecker, J.P. (2000) Nature Neurosci. 3, 966.
26. Kaas, J.H. & Hackett, T.A. (2000) Proc. Natl. Acad. Sci. USA 97, 11793-11799.
27. Rauschecker, J.P. & Tian, B. (2000) Proc. Natl. Acad. Sci. USA 97, 11800-11806.
28. Tian, B., Reser, D., Durham, A., Kustov, A. & Rauschecker, J.P. (2001) Science 292, 290-293.
29. Alain, C., Arnott, S.R., Hevenor, S., Graham, S. & Grady, C.L. (2001) Proc. Natl. Acad. Sci. USA 98, 12301-12306.
30. Maeder, P.P., Meuli, R.A., Adriani, M., Bellmann, A., Fornari, E., Thiran, J.P., Pittet, A. & Clarke, S. (2001) NeuroImage 14, 802-816.
31. Warren, J.D., Zielinski, B.A., Green, G.G.R., Rauschecker, J.P. & Griffiths, T.D. (2002) Neuron 34, 139-148.
32. Clarke, S., Bellmann, A., Meuli, R.A., Assal, G. & Steck, A.J. (2000) Neuropsychologia 38, 797-807.

