File:WUPGpnas03 fig4.PNG
From CNBH Acoustic Scale Wiki
Size of this preview: 302 × 598 pixels
Full resolution (355 × 703 pixels, file size: 363 KB, MIME type: image/png)
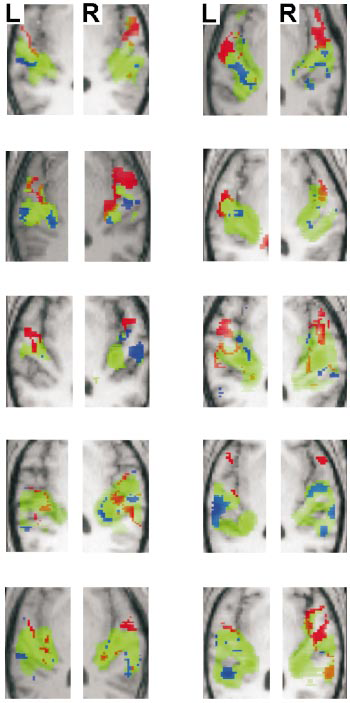
Fig. 4: Statistical parametric maps for individual subjects. Activated voxels (p < 0.001 uncorrected) are rendered on each individual’s structural MRI. The axial section is tilted to run along the superior temporal plane as in Figure 3 and the contrasts and colour key are the same as in Figures 3a and 3d. Bilateral areas including medial Heschl’s gyrus (HG) are activated in the contrast between broadband noise and silence (green). After exclusive masking of voxels activated both by pitch chroma change and by pitch height change, the two pitch dimensions show distinct activation patterns in most individuals: pitch chroma change (but not pitch height change) activates mainly areas anterior to HG on the planum polare (red); pitch height change (but not pitch chroma change) activates mainly planum temporale (blue).
File history
Click on a date/time to view the file as it appeared at that time.
| Date/Time | Thumbnail | Dimensions | User | Comment | |
|---|---|---|---|---|---|
| current | 14:09, 11 September 2008 | | 355×703 (363 KB) | AlessandroB (Talk | contribs) |
- Edit this file using an external application (See the setup instructions for more information)
File links
The following page links to this file: