File:WUPGpnas03 fig3.PNG
From CNBH Acoustic Scale Wiki
Size of this preview: 800 × 325 pixels
Full resolution (876 × 356 pixels, file size: 382 KB, MIME type: image/png)
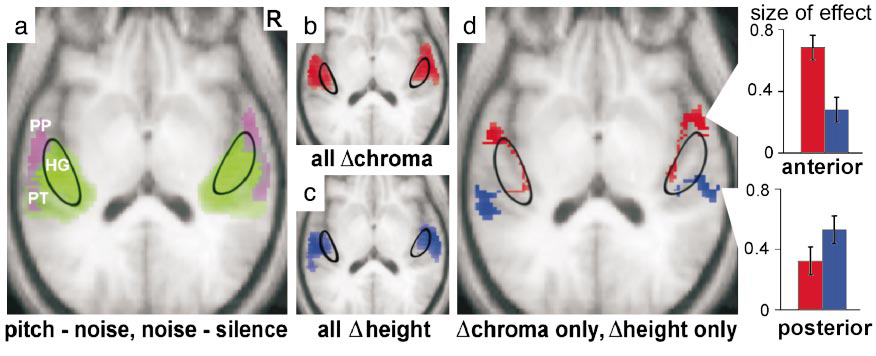
Fig. 3: Statistical parametric maps for the group. For each contrast (indicated below the panel), activated voxels are rendered on the normalized group mean structural MRI in an ‘axial’ section tilted 0.5 radians to include much of the surface of the superior temporal plane. The statistical criterion was p < 0.05 corrected for multiple comparisons across the whole brain volume. The 90% probability boundaries for primary auditory cortex (6) are outlined (black). (a) Broadband noise contrasted with silence (noise – silence, green) activates extensive bilateral superior temporal areas including both medial and lateral Heschl’s gyrus (HG). The pitch-producing stimuli contrasted with noise (pitch – noise, lilac) produce more restricted bilateral activation in lateral HG, planum polare (PP) and planum temporale (PT). (b) Pitch chroma change contrasted with fixed chroma (all chroma, red) activates bilateral areas in lateral HG, PP and antero-lateral PT. (c) Pitch height change contrasted with fixed height (all height, blue) activates bilateral areas in lateral HG and antero-lateral PT. (d) Voxels in Figures 3b and 3c activated both by pitch chroma change and by pitch height change have been exclusively masked. Pitch chroma change but not height change ( chroma only, red) activates bilateral areas anterior to HG in PP; pitch height change but not chroma change ( height only, blue) activates bilateral areas in posterior PT. These areas represent distinct brain substrates for processing the two musical dimensions of pitch. The relative magnitude of the BOLD signal change in anterior and posterior areas is shown for each of the contrasts of interest (right). The height of the histogram columns represents the mean size of effect (signal change) relative to global mean signal for the contrasts chroma-only (red) and height-only (blue) at the peak voxels for each contrast in the right hemisphere; vertical bars represent the standard error of the mean size of effect. The histograms demonstrate opposite patterns of pitch chroma and pitch height processing in anterior and posterior auditory areas.
File history
Click on a date/time to view the file as it appeared at that time.
| Date/Time | Thumbnail | Dimensions | User | Comment | |
|---|---|---|---|---|---|
| current | 14:05, 11 September 2008 | 876×356 (382 KB) | AlessandroB (Talk | contribs) |
- Edit this file using an external application (See the setup instructions for more information)
File links
The following 2 pages link to this file: