Auditory-Based Processing of Communication Sounds/Introduction
From CNBH Acoustic Scale Wiki
Thomas C. Walters
The human auditory system is a remarkable signal processing device, which is optimised for the analysis of communication sounds in challenging acoustic environments. As I write this introduction, I am sitting in a crowded cafe; there are at least a dozen different conversations going on around me, music playing in the background, a noisy espresso machine in front of me, vehicles passing in the street outside and baby crying just to my right. From this cacophony I can trivially identify the various sound sources, and turning my attention to one of them and concentrating, I can follow a conversation, identify the song playing, or track the progress of an emergency vehicle down the street. This wealth of information comes from the analysis of a pair of waveforms by a combination of a dynamically-controlled 'hardware' system, in the form of the cochlea, and signal processing 'software' in the form of neurons all the way up the auditory pathway from the cochlear nucleus to primary auditory cortex and beyond. The systems in our heads which perform this processing are the result of hundreds of millions of years of evolutionary fine-tuning, and we have only begun to understand how they work. However, just because we don't fully understand every aspect of auditory processing doesn't mean that we shouldn't try to put what we do know to good use.
Ever since computing devices entered the popular consciousness, there has been a rather anthropomorphic expectation that such machines should be able to parse complex auditory and visual scenes with ease. Such an expectation is not unreasonable; `If we can do these tasks so easily,' runs the train of thought, `then it must be trivial for these complicated computing machines.' Of course, nothing could be further from the truth. There is some decidedly non-trivial computation going on in our skulls. However, by learning what makes our own abilities so special, and then applying some of the tricks that we learn to the automated analysis of audio we hope to improve the performance of machine systems which attempt to understand some features of sound.
This thesis covers a few aspects of the still-nascent field of 'machine hearing': the application of models of human audition to the analysis of complex audio signals by machines. These models, which are sometimes very simplistic, are used to generate feature streams which can be passed to automated systems to extract meaning from sounds. Making use of some of the features of the auditory system which are believed to assist in the processing of communication sounds. This combination of physiological simulation and engineering application is not new. For example, the quasi-logarithmic mel frequency scale employed by mel-frequency cepstral coefficient (MFCC) features (which are ubiquitous in content-based audio analysis) is based on observations about human pitch perception. However machine hearing is based far more upon the systematic application of knowledge and results from the study of human hearing to audio analysis problems.
In this thesis the auditory image model (AIM), is used as the basis of the auditory model. Two different feature representation are developed and tested. One on a simple speech recognition task, the second on a more complex sound-effects analysis task. As part of this undertaking, the physiological basis of auditory processing is reviewed, and used to inform improvements to various parts of AIM. As a test of the features produced, AIM is used as a preprocessor for an automatic speech recognition system and an audio search engine.
AIM is an existing computational model of human auditory processing. It simulates the processing which goes on in the early stages of the human auditory pathway, and its design is informed by the physiology of the auditory system. In this thesis, aspects of AIM are developed and refined for use in machine hearing, both by the use of data on human physiology and perception, and by the application of prior knowledge of the structure of communication sounds. The representations of sound generated by AIM are further processed to produce sets of features which describe perceptually-salient aspects of the input sound. Two machine hearing systems are developed; these systems use the auditory features produced by AIM in a speech recognition task and a sound-effects search task. Significantly, the systems are able to scale to large datasets, allowing the use of auditory features in machine learning tasks requiring hundreds of hours of training data.
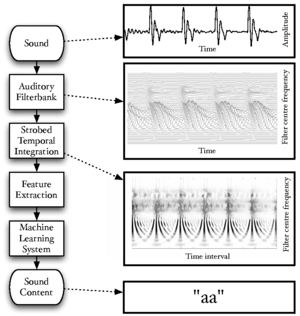
Figure 1 is a block diagram showing the overall structure of the auditory image model when used as a preprocessor for machine hearing applications. This thesis concerns itself with all sections of the model, from the input audio to the machine learning system. This introduction provides an overview of the sounds used by animals to communicate, and outlines the structure of the systems which are described in more detail in later chapters; in particular, AIM is introduced in this chapter. Chapter 2 describes the use of a simple auditory filterbank to produce features for a syllable recognition task. The features generated are designed to be scale-shift invariant, mimicking an important feature of human perception of communication sounds. Chapter 3 deals with the generation of stabilised auditory images from the output of the cochlear model, and in particular the process of strobe detection for the strobed temporal integration process. Chapter 4 describes the generation of noise-robust auditory features by use of the stabilised auditory image (SAI) generated by AIM. The process of strobed temporal integration in AIM is found to create features which are more roust to interfering noise than simple spectral features. In chapter 5, various models of human auditory filtering are assessed; these models simulate the response of the outer and middle ear, the nonlinear response of the cochlea, and the neural transduction performed by the inner hair cells, leading to a simulation of the signal transmitted up the auditory nerve in response to any sound. Two different models of the compressive auditory filter are compared and improved by reference to the physiology of hearing and the constraints of the auditory model. Finally in chapter 6, a complete machine hearing system comprising a compressive filterbank, a stabilised auditory image, a sparse feature representation and a machine learning system is used as a sound-effects search tool which is capable of associating text terms with the content of audio files.
Contents |
Communication sounds

The voiced parts of human speech take the form of pulse-resonance signals. The production mechanism for these sounds is simple: the vocal folds interrupt the stream of air from the lungs periodically, producing a stream of pulses which excite resonances of the vocal tract above the larynx. The form of the resonances carries information about the body which produced them. Figure 2 shows a cross-section of the human vocal tract; in human speech the configuration of the excited vocal tract, and thus the resonance pattern which it produces, carries information about the vowel which was spoken. This is the source-filter model of speech production (Dudley, 1939).
Pulse-resonance communication sounds are used as a primary means of communication, in one form or another, by most animals. The production system is similar in each case, a sharp pulse or series of pulses excites resonances in the body of the animal, and these resonances carry distinctive information about the shape and size of the resonating body (Patterson, Smith, van Dinther and Walters, 2008)<ref>For the first reference to publications that I have been personally involved with, I cite the author list in full to emphasise that I was involved in the work during the course of my PhD.</ref>.
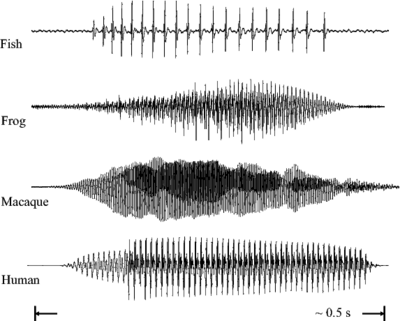
Figure 3 (as published in Patterson et al., 2008) shows the communication 'syllables' of four different animals. Each 'syllable' is an example of a pulse-resonance sound. In each case the pulse-rate is different, and the form of the resonance following each pulse is different. The pulse rate determines the pitch of the sound, and the form of the resonance contains information about the shape and the size of the resonating structures in the body of the animal.
The pulse production mechanisms used by the fish, the frog and the mammals in this example are very different. Both of the mammals use the vocal folds in the larynx to periodically interrupt the flow of air from the lungs. The frog pushes air between its lungs and an air sac, causing a resonance in its tympanic membrane (Purgue, 1997), and fish employ mechanisms such as swift contraction of a ring of muscle around the swimbladder (Sprague, 2000).
In addition to human and animal vocalisations, van Dinther and Patterson (2006) suggest that the sounds produced by sustained-tone instruments can also be well modelled as pulse-resonance sounds. This means that a wide range of the sounds which are encountered by humans in their everyday life take this form.
Size information in communication sounds
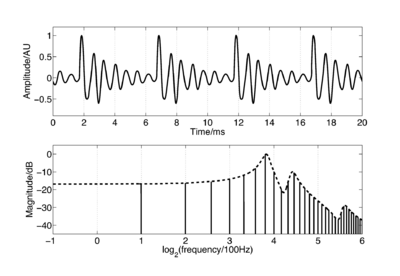
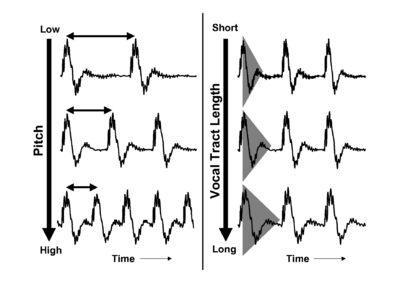
When a pulse excites resonances in the body of a calling animal, the form of the resonances provides information about the resonating body. The shape and structure of the body make a major contribution to the form of the resonance, but so too does the overall size of the resonating body. If two animals of the same species make the same call, then the major factor that distinguishes the two calls will be the sizes of the calling individuals. Figure 4 shows a short section of the waveform (upper panel) and spectrum (lower panel) of a synthetic /a/ vowel, as might be spoken by a child. The waveform shows that the vowel is composed of a series of glottal pulses, followed by decaying resonances. The Fourier magnitude spectrum in the lower panel is shown as a set of vertical lines, and the spectral envelope is shown as a dashed line connecting the peaks of the magnitude spectrum. The shape of this envelope corresponds to the form of the damped resonance following each pulse, and the spacing of the harmonic peaks is determined by the pulse rate. As a child grows into an adult, the length of the vocal tract increases and the average glottal pulse rate (GPR) decreases as the vocal cords develop (Lee et al., 1999). Vocal tract length (VTL) increases in proportion to height (Fitch and Giedd, 1999; Turner and Patterson, 2003; Turner et al., 2009), and people approximately double in height from the time that they start speaking to the time they are fully grown, meaning that formant frequencies approximately halve over this time. An increase in vocal tract length causes the resonance following each pulse to ring longer and decay more slowly. In the frequency domain, this corresponds to a shift of the spectral envelope on a log-frequency scale. A decrease in glottal pulse rate causes the time between pulses to increase; in the frequency domain this leads to the harmonic peaks becoming more closely spaced. Figure 5 shows the waveforms for real human vowels, which have been scaled to simulate these changes in GPR (left) and VTL (right).
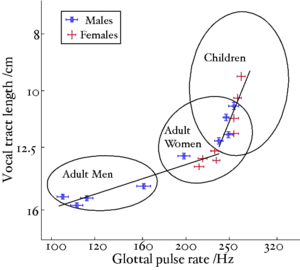
A reanalysis of the classic formant data of Peterson and Barney (1952) by Turner, Walters, Monaghan and Patterson (2009) showed that the relative formant pattern that defines a particular vowel remains approximately unchanged as children grow into adults. Turner et al. also developed a technique to infer VTL values from the formant frequency data of Peterson and Barney and Huber et al. (1999) allowing them to plot the position of men, women and children in the GPR-VTL plane, and show the trajectories that humans pass through in the space as they develop. Figure 6 is taken from Turner et al.. The ellipses show the position of, from left to right, men, women and children in the GPR-VTL plane. They are plotted at two standard deviations, so they enclose around 80% of the speakers in that particular class. The solid lines are regression lines though the data points from Huber et al.. All speakers, boys and girls, start off at the top right of the space, as boys and girls grow up, their voices develop in the same way initially, but at puberty there is a sudden drop in pitch in the boys' voices and they end up moving very quickly to their final position with a much lower GPR and slightly longer VTL than women.
Size information is also seen in the calls of animals, for example there is a strong correlation between the body size of the North American bullfrog (Rana catesbiana) and the fundamental frequency of its call (Gomersall, Walters and Patterson, 2005).
The scaling of communication sounds
STRAIGHT (Kawahara and Irino, 2004; Kawahara et al., 1999) is a high-quality vocoder that is capable of analysing speech with glottal-cycle resolution. STRAIGHT's processing scheme is based on the classic source-filter model of speech production (Dudley, 1939). Speech sounds are modelled as being a stream of glottal pulses, the source, which pass through the vocal tract, the filter. STRAIGHT is able to independently extract the pitch track and the spectral envelope from human vocalisations. The pitch track and spectral envelope can then be manipulated independently before the sound is re-synthesised. Using STRAIGHT it is therefore possible to scale human vocalisations in the GPR and VTL dimensions independently. This has proved an invaluable tool for research into both human perception and normalisation of communication sounds (Ives, Smith and Patterson, 2005; Smith and Patterson, 2005; Smith, Patterson, Turner, Kawahara and Irino, 2005; Smith, Walters and Patterson, 2007; Walters, Gomersall, Turner and Patterson, 2008) and into speaker-independent automatic speech recognition (Monaghan, Feldbauer, Walters and Patterson, 2008; Feldbauer, Monaghan and Patterson, 2008).
STRAIGHT works by first extracting a pitch, or fundamental frequency (f0) track for a sound. This is done by a combination of spectral and temporal analysis. In the frequency domain, instantaneous f0 extraction is performed using an analysis wavelet that encodes prior information about the expected shape of the distribution of harmonics in a voiced speech sound. This is combined with a time-domain normalised autocorrelation analysis to reduce f0 errors. Once an accurate pitch track has been extracted, the sound is re-analysed using a pitch-synchronous window. Typically when a periodic sound is analysed using a short-window Fourier transform, the periodicity of the waveform and the window size interfere to create a periodic temporal structure in the extracted spectrogram. STRAIGHT uses a smooth windowing function that is temporally modulated with the periodicity of the incoming audio signal. This leads to a temporally smooth spectrogram. The harmonic structure of the spectrogram is then removed using a spline-based smoothing technique, leaving the reconstructed spectral envelope, independent of the pitch.
Human perception of size
Humans are remarkably good at understanding the content of vocalisations that come from a wide range of speakers. Smith, Patterson, Turner, Kawahara and Irino (2005) demonstrated that humans could accurately identify vowel sounds that had been scaled to VTL and GPR values well outside the range of normal experience. In that study, Smith et al. presented scaled versions of five human vowels (/a/, /e/, /i/, /o/ and /u/) to human subjects in a 5-alternative forced-choice experiment. The vowels were scaled in GPR and VTL using the vocoder STRAIGHT (Kawahara et al., 1999). The scaling encompassed VTL values corresponding to humans from one-third the height to twice the height of an average man, and GPR values from 10Hz to 640Hz. At 10Hz, the sounds were below the lower limit of pitch, but subjects were still able to detect the vowel type from the individual pulses and resonances. Smith et al. found that combined recognition performance fell to 50% (still better than chance) only at the very far extremes of the GPR and VTL range, despite the fact that these are well outside the range of normal experience. While it is possible that humans simply learn to recognise speech by hearing examples from a wide variety of sizes of speaker, the fact that recognition performance continues to be high well outside the range of normal experience suggests that there may be some sort of automatic size-normalisation system within the human auditory system.
Ives et al. (2005) extended the stimuli from the study of Smith et al. (2005) to a large database of 180 consonant-vowel and vowel-consonant syllables. They again showed that recognition performance was extremely good across the entire range of GPR and VTL; indeed, performance was better than for the vowels alone.
In a related study, Smith and Patterson (2005), again using scaled vowels, demonstrated that VTL has a strong effect on the perception of speaker size. In this experiment, listeners were asked to judge the height of a speaker with a given combination of GPR and VTL on a seven-point scale from 'very tall' to 'very short'. Listeners were also asked to judge the sex and the age of the presented speakers from four choices: 'man', 'woman', 'boy' and 'girl'. Size judgements were strongly affected by VTL and only slightly affected by GPR. Sex and age judgements for vowels with GPR and VTL values in the range of normally-encountered speakers were influenced about equally by both variables, but for vowels with low GPR and short VTL, VTL played a greater role in the decision.
Extending from this study, Walters, Gomersall, Turner and Patterson (2008) attempted to identify the 'trading relationship' between VTL and GPR in making judgements of speaker size. Listeners compared sequences of vowels scaled in GPR and VTL to represent speakers with slightly different sizes. The experiment was of a two-alternative forced-choice design, in which subjects were required to choose the interval with the smaller speaker. By comparing speakers around a point in the GPR-VTL plane, an estimate of the gradient of the VTL-GPR plane at that point was made. The vectors across the GPR-VTL plane were integrated to estimate the size surface. The results indicated that the size surface would be essentially planar if determined by size discrimination alone. This suggests that relative size judgements are different from absolute size judgements.
The stimuli in all the above experiments were synthesised from a single speaker. Smith, Walters and Patterson (2007) investigated the role of the input speaker on the perception of speaker size. In this study, sustained vowels from men, women and male and female children were scaled using STRAIGHT to a range of VTLs and GPRs. Subjects were then asked to identify whether they thought the vowel had come from a man, a woman, a boy, or a girl. Smith et al. found that while the sex of the input speaker did not make a significant difference to the judgement, the age of the speaker did. This prompted them to suggest that the differences in the ratio of the sizes of the oral cavity and pharynx between children and adults may account for the difference. However, vowel formant ratios are known to remain largely fixed as children grow up. Taken together, these two pieces of evidence suggest that speakers may actively vary the position of their tongue in the oral cavity to maintain a fixed formant ratio, regardless of anatomical differences.
van Dinther and Patterson (2006) performed a similar study to those described above, but used musical instrument sounds as the input pulse-resonance signals for size discrimination. They demonstrated that, as with human vocalisations, subjects were able to detect relatively small changes in the scale of the resonance in the notes of sustained tones from string, woodwind and brass instruments, and singing voices. This suggests that the normalisation mechanisms at work may be the same for human voices and for other pulse-resonance sounds.
The problem of automatic vocal tract length normalisation (VTLN) is an area of active research in speech recognition. Approaches to VTLN include warping the frequency spectrum of the input sound before feature computation (Welling et al., 2002) to more complex systems such as cross-correlation of the spectra at various points in time to extract a locally-normalised spectrum (Mertins and Rademacher, 2005). Inspired by the observation that humans appear to be able to perform VTLN automatically on the incoming signal, in chapter 2, an alternative feature representation for machine hearing which is invariant to changes in the size of the source is developed and tested.
The auditory image model
The auditory image model (AIM) (Patterson et al., 1992; Patterson et al., 1995) is a computational model of auditory processing. It is the basis for most of the work in this thesis. AIM is a functional model of the signal processing performed in the auditory pathway; it consists of modules which simulate the stages of processing which occur as the system converts a sound wave into the initial percept which a human experiences when presented with a sound, but before any semantic meaning is attached to the sound. The first three stages of the model simulate the effect on the signal of the outer and middle ear, the cochlea, and the hair cells which translate the motion of the cochlear partition into neural impulses. These stages are all based on the physical properties of the various structures and systems which perform the processing. The subsequent stages of the model are based less upon observations of the physical processes and more upon observations of human perception of sounds. These latter stages convert the incoming sound into a 'stabilised auditory image' (SAI). This is a representation in which sounds that are perceived as stable by humans give rise to stable auditory images. The SAI is a 'movie' with 2-dimensional frames along the time dimension; each frame has two dimensions: cochlear channel and time interval. The pulse rate (pitch), the resonance scale (size) and the form of the resonance (the message) of the incoming sound are segregated as far as possible into covariant dimensions in this representation.
The human auditory system
The human auditory system is an immensely powerful signal processing system. It can deal with sounds from a whisper to a rock concert -- over 10 orders of magnitude difference in intensity (Moore, 2003) -- and it can extract meaning from sounds which have been heavily degraded by the addition of background noise or sounds from competing sources (Miller and Licklider, 1950). The anatomy of the peripheral auditory system is illustrated in Figure 7.
One of the central premises of this thesis is that a great deal may be learned from the auditory system about the best strategies for the extraction of salient information from sounds. Models of aspects of auditory processing are used as the basis for audio compression schemes including MP3 and AAC (Brandenburg and Stoll, 1994; !! Unknown ref iso:1993 !!; !! Unknown ref iso:1997 !!) and auditory models have been recommended for the enhancement and segregation of speech sounds in noisy environments (Slaney et al., 1994; Irino et al., 2006). However, the standard features used for content-based audio analysis tasks, such as speech recognition (Young et al., 2005) and music information retrieval (Bergstra et al., 2006), are usually based on the more simple short-window Fourier transform as a first processing step.

Example stimuli
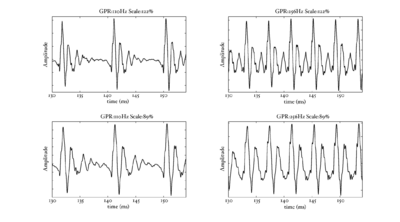
In the next few sections, the workings of AIM will be discussed. In order to illustrate each stage, four STRAIGHT-scaled vowel sounds will be processed using the model, and plotted side-by-side for comparison. The four vowels are shown in Figure 8; each is an /a/ vowel. Each subfigure of Figure 8 shows the waveform from a different speaker uttering the vowel sound. In the lower subfigures, the waveforms have a resonance rate of 89% of that of the original speaker. This corresponds to a person with a VTL of approximately 17.5cm or of height of 194cm. In the upper subfigures are the waveforms for a resonance rate of 122% (VTL 12.7cm; height 142cm). The left subfigures are for a GPR of 110 Hz and the right subfigures for a GPR of 256 Hz.
Outer and middle ear
The first structures of the auditory system which are encountered by an incoming sound wave are the outer and middle ear. The pre-cochlear processing (PCP) module applies a filter to the input signal to simulate the transfer function from the sound field to the oval window of the cochlea. The purpose is to compensate for the frequency-dependent transmission characteristics of the outer ear (pinna and ear canal), the tympanic membrane, and the middle ear (ossicular bones). At absolute threshold, the transducers in the cochlea are assumed to be equally sensitive to audible sounds, so the pre-processing filters apply a transfer function similar to the shape of hearing threshold. The default version of PCP applies the function described by Glasberg and Moore (2002).
The cochlea
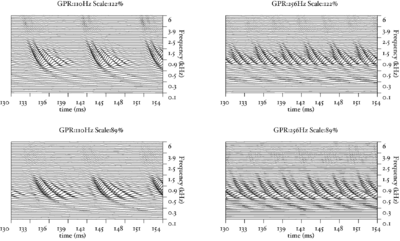
The basilar membrane motion (BMM) module in AIM simulates the spectral analysis performed in the cochlea with an auditory filterbank. Figure 9 shows the output of the AIM BMM module for the four input sounds from above. The output of the BMM stage is a multi-channel representation of the incoming sound; the output channels correspond to the motion over time of points spaced equally along the length of the basilar membrane. The configuration of the basilar membrane is such that equally spaced points respond preferentially to frequencies which are spaced along a quasi-logarithmic scale such as the ERB scale (Smith and Abel, 1999). There is essentially no temporal averaging, in contrast to spectrographic representations where segments of sound 10 to 40 ms in duration are summarised in a spectral vector of magnitude values. There exist several different filterbanks in AIM; the default, the gammatone (Patterson and Moore, 1986), is a passive linear filter which does not simulate any of the level-dependent properties of auditory filtering. More realistic and more complex models of the auditory filter are provided by the dynamic compressive gammachirp (dcGC) (Irino and Patterson, 2006) and pole-zero filter cascade (PZFC) (Lyon et al., 2010). Both of these models include level-dependent asymmetry, and fast acting compression. The BMM plots in Figure 9 were generated using the dcGC filterbank. In the plots, time runs along the horizontal axis, and cochlear channel is along the vertical axis. The higher-frequency cochlear channels are at the top of the plot. The pulse-resonance structure of the vowel sounds is clearly visible; the pulses excite filters at all frequencies, leading to a periodic curved ridge in the plots. For the high glottal pulse rate (right panels), the pulses occur more frequently. After the pulse, the filters in all channels then ring. The resonances that follow the pulses in the input sound put energy into the filters at some frequencies, causing them to ring for longer and decay more slowly. These resonances are the formants of speech. For the short VTL (upper panels), the entire pattern of formants is shifted up in frequency and decays faster in time. Chapter 5 investigates the benefits of using a compressive filterbank for the task of pitch detection.
Neural activity pattern
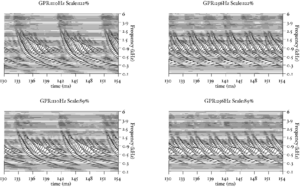
The basilar membrane motion is converted into a simulation of the neural activity pattern (NAP) observed in the auditory nerve using a model of the neural transduction that occurs in the hair cells of the cochlea. The most important feature of this stage is that the signal is half-wave rectified, mimicking the unipolar response of the hair cell, while keeping it phase-locked to the peaks in the wave. Experiments on pitch perception indicate that the fine structure retained by phase-locking is required to predict the pitch shift of the residue (Yost et al., 1998). Other rectification algorithms like squaring, full-wave rectification and the Hilbert transform only preserve the envelope. At this stage, it is also possible to apply compression to the waveform. The compression is intended to simulate the cochlear compression which is essential to cope with the large dynamic range of natural sounds.This compression is already present in the dcGC and PZFC filters, but is absent in the gammatone filters. Figure 10 shows the results of NAP processing on the four vowels.
Strobed temporal integration

The next stage of the model is the identification of significant or `strobe' points in the NAP. Perceptual research on pitch and timbre indicates that at least some of the fine-grain time-interval information in the NAP survives to later stages of the auditory pathway (Krumbholz et al., 2003; Patterson, 1994a; Patterson, 1994b; Yost et al., 1998). This means that the temporal integration that occurs in the auditory system cannot be simulated by a running temporal average process, since averaging over time destroys the temporal fine structure within the averaging window (Patterson et al., 1995). Patterson et al. (1992) argued that it is the fine-structure of periodic sounds that is preserved rather than the fine-structure of noises, and they showed that this information could be preserved by finding peaks in the neural activity as it flows from the cochlea, measuring time intervals from these strobe points to smaller peaks, and forming a histogram of the time-intervals, one for each channel of the filterbank. This two-stage temporal integration process is referred to as strobed temporal integration (STI). The strobe-point-finding (or 'strobing') process identifies certain peaks in the NAP and the timings of these strobe points are used to initiate a temporal integration process in the following stage. The strobe pulses enable the segregation of the pulse and resonance information and they control pulse-rate normalisation. For ideal pulse-rate normalisation, the chosen NAP peaks should correspond to the onset of a pulse in the input sound. However, auditory image construction is robust, in the sense that strobing does not have to occur exactly once per cycle to be effective.
Strobe detection in AIM is performed using a dynamic thresholding technique. Figure 11 shows the 'parabola' dynamic thresholding algorithm applied to a NAP. A threshold which decays linearly over time is placed on the signal; when the signal exceeds the threshold a strobe point is issued, and the threshold rises briefly above the level of the signal at that point. The threshold then decays again until it meets the signal and the process repeats. This has the effect of causing strobes to be issued only on certain peaks in the NAP.

Figure 12 shows the results of applying the same algorithm to the NAP output for the four vowels. The strobe points clearly cluster around the glottal pulses, but they do not occur exclusively at those times.
The SAI module uses the strobe points to convert the NAP into an auditory image, in which the pulse-resonance pattern of a periodic sound is stabilised using the strobe points generated in the previous stage.
The 'ti2003' algorithm is the default method for generating SAIs in the software packages AIM-MAT and AIM-C (which are discussed below). It works in the following way. When a strobe occurs it initiates a temporal integration process during which NAP values are added into the corresponding channel of the SAI as they are generated; the time interval between the strobe and a given NAP value determines the position where the NAP value is entered in the SAI. In the absence of any succeeding strobes, the process continues for 35ms and then terminates. If more strobes appear within 35 ms, as they usually do in music and speech, then each strobe initiates a new temporal integration process. Each process is given a weight with which NAP values from that process are added to the SAI. Initially these weights are inversely proportional to the index of the strobe in the series so, for example, if there are three active strobes, the oldest strobe is added with weight 1/3 relative to the most recent strobe which is added with weight 1. Finally, the weight set is normalised to sum to unity so that the overall level of the auditory image is normalised to that of the NAP.
STI converts the time dimension of the NAP into a time-interval dimension in the stabilised auditory image (SAI). A series of vertical ridges appear in the auditory image. These are associated with the repetition rate of the source and can be used to identify the start point for any resonance in that channel. It is this property which makes it possible to segregate the glottal pulse rate from the resonance structure of the vocal tract in the SAI.
In chapter 3, the properties of an 'ideal' strobe detection system are defined, and a number of strobe detection systems are presented and analysed based on this definition.
Figure 13 shows the results of the STI process for the four vowels. The zero-lag point is not shown in this representation, but the vertical ridge due to the pulse rate of the original waveform is clearly visible, and can be seen to shift as the pulse rate changes. The formants appear as 'flags' running horizontally from the vertical pitch ridge. The formats shift up in frequency and get narrower in the time-interval dimension from the long VTL waveforms to the short VTL.

The STI process can be thought of as a modified form of autocorrelation. In autocorrelation, a signal is cross-correlated with itself to yield a measure of how well-correlated the signal is with itself when delayed by a range of different `lags'. Zero-lag is at the centre of the output, and the function is symmetrical about this point. In STI, the signal is instead cross-correlated with a function that is zero everywhere except at the strobe points. The height of the signal at these strobe points determines the weight with which that time interval is represented in the output. The process is less computationally intensive than autocorrelation, as one of the signals is sparse, being composed mostly of zeros. Unlike autocorrelation, the resulting output is no longer symmetrical about the zero-lag point (Irino and Patterson, 1997), and any temporal asymmetry in the input signal is preserved. This is an important feature of the SAI, as temporal asymmetry is a key feature of pulse-resonance sounds (Patterson and Irino, 1998). Figure 14 shows correlograms for the four vowel sounds. The zero-lag line is at the left of the image. Each of the structures due to the pulse repetition rate is more symmetrical in the correlogram than in the stabilised auditory image.

It is worth noting that a huge increase in the data rate passing through the model takes place as the waveform is converted to a SAI through the AIM processes. In a standard simulation, a single time-domain waveform might be split into 50 time-domain channels, each with the same data-rate as the original waveform. SAIs can then be generated from these data at an arbitrarily high rate. Superficially, this seems like an extremely wasteful set of transformations to perform on a signal, but the benefit of this approach is that the space that the signal lies in after these transformations has the property that the pulse-rate and resonance information appear into two largely orthogonal dimensions -- a key property of the auditory model. The challenge in using such a representation for content-based audio analysis tasks is to reduce this data rate to a manageable level in a principled way, so that the useful properties of the space are preserved, but the feature size is not overwhelming for whatever machine learning system is subsequently used. Chapters 4 and 6 of this thesis examine two approaches to performing this data rate reduction.
Software
The two major software tools used in this thesis are AIM-MAT (Bleeck et al., 2004) and AIM-C, the MATLAB and C++ implementations of AIM. The implementations are in many ways complementary. AIM-MAT provides an environment in which processing modules can easily be tested and compared, and it makes it extremely easy to visualise the results of processing. AIM-C by contrast provides capabilities for the fast processing of long audio files through a pre-prepared set of modules. Both AIM-MAT and AIM-C were written in the CNBH lab in Cambridge. AIM-MAT was written by Stefan Bleeck and was released in 2004. I wrote AIM-C between 2006 and 2009. I worked on the initial design and much of the early infrastructure code with Willem van Engen, a Masters student whom I supervised in 2006.
Both AIM-MAT and AIM-C have a modular architecture. The individual stages of the auditory image model (PCP, BMM, NAP, Strobes and SAI) are implemented as separate, interchangeable modules. With this design, it is simple to write and test individual modules for the different stages of processing, and to easily test different combinations of these modules. In AIM-MAT it is possible to easily visualise the output of the different modules by use of the graphical user interface. The main motivation for the development of AIM-C was to improve the speed of processing available. One major design limitation of AIM-MAT is that all the processing for one module is performed before the next module, so if a long sound is processed it must be run in its entirety through the BMM module, for example, before being passed on to the later modules. This means that the entire processed output must be stored in memory at each stage. Given the massive increase in data rate that happens at the BMM and SAI stages of the model, this means that only short sounds (on the order of a few seconds) can be processed before the host computer runs out of RAM. AIM-C, by contrast, has a block-based 'pipeline' architecture in which short segments of the audio are processed through each stage of the model in turn, and stored only at the end. This allows AIM-C to process arbitrarily long pieces of audio, limited only by the available hard drive space of the host machine. AIM-C is also significantly faster at processing sounds, since it is written in C++ rather than MATLAB. On a modern machine, AIM-C is capable of processing audio in realtime, with a 30-channel filterbank, and displaying the generated SAI with only a short delay of around 50ms.
AIM-C includes modules for the gammatone, dcGC and PZFC filterbanks and for various strobed temporal integration algorithms. The filterbank implementations in AIM-C run considerably faster than the equivalent versions in AIM-MAT. In general, there is at least an order of magnitude improvement in speed available in using AIM-C over AIM-MAT. This speed increase is crucial when processing large datasets. It is AIM-C that made it possible to perform the syllable recognition studies presented in chapters 2 and 4.
Invariance properties of the auditory system
The auditory system has two important invariance properties in its processing of sounds. The first is that it is time shift invariant: the sound we hear is independent of the time that it occurs<ref>From a perceptual point of view, it is not necessarily always the case that the auditory system is fully time-shift invariant; the experiments of Ladefoged and Broadbent (1957), for example, demonstrate that perceptual effects can come into play depending on the relative timing of stimuli. However, these effects occur at a much later stage in the auditory pathway.</ref>. The second property is that, over a wide range of values, it is scale invariant with respect to the message: the same message can be perceived over a range of time-scalings of the input signal.
Time-shift invariance may seem obvious, but it is an important property of the system and leads to certain mathematical constraints. In the case of a time-scaling of the signal, there is a clearly perceptible change in the sound itself, but the message information itself is relatively unaffected by the scaling.
In its simplest form, scale invariance can be seen as an invariance to changing the 'tape speed' of a signal. Imagine a tape or vinyl recording of speech which is played back at the wrong speed. For a wide range of playback speeds, it is still easily possible to discern what the speaker is saying, even if other characteristics of the voice (such as the perceived size or age of the speaker) may change wildly. This is an important observation, as it encompasses both aspects of the size normalisation which we believe that the auditory system must perform. The 'tape speed transform' simultaneously simulates a change in glottal pulse rate, a corresponding change in vocal tract length and a change in the rate of speaking. However, it is also possible for these three properties to change independently: a speaker changes the pitch of their voice through an utterance, people with different vocal tract lengths may speak the same phrase with the same pitch, and the same sentence may be uttered at a faster or slower rate. For the purposes of investigating the properties of the early stages of the auditory system, it is only the first two of these properties that are of interest to us since longer-term temporal variations are dealt with at a later stage of processing. Given the observation that the pulse rate and the resonance scale of the system can vary independently, but lead to the same message being perceived, the invariance properties of the system must be more complex than simple time-scale invariance, as the system is invariant to changes in scale on the longer time scale of glottal pulse rate and to changes in the microstructure of the resonances that the glottal pulses excite.
One conclusion from these observations could be that the system must perform some form of deconvolution of the glottal pulses from their associated resonances. In the auditory image model, this deconvolution occurs at the strobe-finding stage. Furthermore, there must be some process that is able to normalise the signal both for changes in pulse rate and changes in resonance scale. In the SAI changes of pulse rate correspond to a change in the horizontal spacing of the vertical pitch ridges, and changes of resonance scale correspond to changes in the vertical position of the resonance structure. So, to a certain extent, the SAI segregates the two forms of scale information into two dimensions of the auditory image. The SAI is also a reasonable representation from a physiological point of view. A two-dimensional frequency-periodicity mapping, like that seen in the auditory image and the correlogram, has been observed in the inferior colliculus of the mammalian brain (Schreiner and Langner, 1988).
The 'size-shape' image (SSI), introduced in chapter 4, processes the SAI further by truncating the signal in each channel after the first pitch ridge, and by scaling the time axis of each channel independently by an amount proportional to the centre frequency of the filter in that channel. This produces a representation that is, as far as possible, pitch invariant and is scale-shift covariant; changes in resonance scale correspond to a simple shift of the image in the vertical dimension. The question of how best to transform the SSI from a pitch-invariant, scale-shift covariant representation to a pitch-invariant, scale-shift invariant representation is still an open one. The Mellin image (Irino and Patterson, 2002) has been suggested as a possible scale-shift invariant representation. The techniques employed in chapters 2 and 4 (to generate features from auditory models for a speech recognition system) produce a representation of the spectral profile of the auditory image that is scale-shift invariant.
Time-frequency and time-scale uncertainty relations
The short-time Fourier transform (STFT) is a joint time-frequency representation of a signal: it transforms a 1-dimensional signal into a 2-dimensional time-frequency representation. Using methods from operator theory, it is possible to show that there is an uncertainty relation between time and frequency (since the time and frequency operators have a nonzero commutator), and it is possible to derive the set of functions which satisfy the conditions for minimal uncertainty. In the case of the joint time-frequency representation, the minimum uncertainty function is the Gabor function. Similarly, Cohen (1993) has investigated operator methods for a joint time-scale representation of a signal, where scale is seen as a physical property of the signal, just like frequency. Irino and Patterson (Irino and Patterson, 1997) employed these methods in their development of the gammachirp auditory filter. The gammachirp is in fact the minimal uncertainty function for a joint time-scale representation of a signal.
MFCCs
When designing new representations of sounds for content-based analysis, it is important to understand the systems which are currently used for these tasks. Mel-frequency cepstral coefficients (MFCCs) (Mermelstein, 1976; Davis and Mermelstein, 1990; Bridle and Brown, 1974) have been used for years as one of the primary representations of audio for speech recognition (Huang et al., 2001) and speaker recognition (Ganchev et al., 2005), and have found applications in many other content-based audio analysis tasks such as music genre classification (Bergstra et al., 2006). MFCCs have some excellent properties: they are cheap to compute, they produce coefficients that are reasonably independent of one another (a useful property for many machine-learning systems), and they have been applied extremely successfully to many applications.
MFCCs are calculated by taking the Fourier spectrum of a short, windowed portion of a signal (typically around 25ms). The frequency spectrum is then mapped onto the mel scale (Stevens et al., 1937) by means of a bank of triangular filters, and the logarithm of the power at each of the mel frequencies is taken. A discrete cosine transform (DCT) is then performed on the log filterbank output. This transformed representation is known as the `cepstrum' (a play on the word `spectrum'). Taking the logarithm of the power spectrum means that a convolution in the time domain corresponds to summation in this log-frequency domain. This is a useful property, since if the input audio is a pulse-resonance sound, in which a train of pulses is convolved with a resonance, then the log-spectrum can be viewed as a sum of the contribution from the pulse train and a contribution from the filter. This summation property also holds for the cepstrum. Akin to filtering in the frequency domain, `liftering' can be applied in the cepstral domain. Typically the mel-frequency cepstrum is low-pass liftered by discarding all but the lowest DCT coefficients (in many standard implementations, the first 13 coefficients are retained). These DCT coefficients are the mel-frequency cepstral coefficients. The low-pass liftering of the cepstrum removes much of the harmonic structure present in the original spectrum, meaning that the MFCCs capture the overall spectral shape of a sound well, but they are not very sensitive to pitch.
This thesis
In this thesis, I evaluate and develop some of the many aspects of the auditory image model, with a focus on using AIM to generate features that provide useful and salient information about the content of sound to machine learning systems. To do this, it is necessary to find a balance between accurately simulating the physiology and developing practical systems. In order to make these decisions, it is necessary to have a good understanding of the properties of all aspects of the system that might help them improve audio analysis tasks. In this thesis, I model a number of properties of the auditory system, from macroscopic, behavioural observations, right down to the analysis of fine timing in the cochlea, and assess systems based on these models on audio analysis tasks. As the observations and investigations become more low-level, the mode of evaluation changes, but the goal is to gain useful information about the behaviour of the system at each level. Finally, a complete audio analysis system is constructed which draws together many of the aspects investigated in the previous chapters. In this thesis I do not, and could not, attempt to assess the effect of every minute parameter change in every subsystem on the overall behaviour of a larger machine hearing system, but rather to assess some of the individual subsystems at the level at which it is most useful to do so.
In chapter 2, a simple syllable recognition system is developed which has the important property of scale-shift invariance. The scale-shift invariant features were motivated by the observation that human listeners can apparently automatically normalise communication sounds for differences in source size. The system uses a linear gammatone filterbank, which is a good first approximation to the cochlear filterbank, but which lacks the fast-acting compression which is known to exist in the cochlea. This system also makes no attempt to use the strobed temporal integration from AIM. This system is an initial proof-of-concept which demonstrates the potential utility of modelling a high-level aspect of auditory processing.
In chapter 3, the strobed temporal integration process is reviewed, refined and then in chapter 4, it is put to use to improve the noise-robustness of the experimental system described in chapter 2, demonstrating one of the benefits of the stabilised auditory image representation.
Chapter 5 deals with producing a system that accurately models the compressive properties of the human cochlea. Based on the observation that compressive filterbanks are able to more accurately model the human perception of stimuli with a weak pitch cue, the effectiveness of a pitch-strength detection system is tested using the linear gammatone filterbank, and the compressive dcGC and PZFC filterbanks as the cochlear front-ends for the model.
In chapter 6, a complete sound analysis system is constructed and analysed. The system uses AIM in one of its variants to generate features from audio to pass to a machine learning system. The technology has not previously existed to run AIM-like models on large databases of sounds. In AIM-C and the machine hearing systems developed at Google, we now have the technology to investigate the application of AIM to large-scale problems. This is an important and notable step forward in the field. Previously the use of AIM had been limited to the analysis of small datasets. The system described is able to process days of audio data in a matter of a few hours by the combination of efficient code and large computing resources.
The overall goal is to define and build a system that can be used for real applications. The system must model the processing performed in the auditory system with a degree of fidelity that reflects the aspects of auditory processing which make it robust and effective in processing communication sounds. However, it must still be possible to implement the system for use in practical applications which benefit from the improved auditory processing.
Footnotes
<references />
Bibliography
- Bergstra, J., Casagrande, N., Erhan, D., Eck, D. and Kégl, B. (2006). “Aggregate features and ADABOOST for music classification.” Machine Learning, 65, p.473-484. [1] [2]
- Bleeck, S., Ives, T. and Patterson, R.D. (2004). “Aim-mat: The Auditory Image Model in MATLAB.” Acta Acustica, 90, p.781-787. [1]
- Brandenburg, K. and Stoll, G. (1994). “ISO-MPEG-1 Audio: A generic standard for coding of high-quality digital audio.” Journal of the Audio Engineering Society, 42, p.780-792. [1]
- Bridle, J. and Brown, M. (1974). “An experimental automatic word recognition system.” JSRU Report, 1003, p.. [1]
- Cohen, L. (1993). “The scale representation.” IEEE Trans. Sig. Proc., 41, p.3275-3292. [1]
- Davis, S.B. and Mermelstein, P. (1990). “Comparison of parametric representations for monosyllabic word recognition in continuously spoken sentences.” Readings in speech recognition, , p.65-74. [1]
- Dudley, H. (1939). “Remaking speech.” J. Acoust. Soc. Am., 11, p.169-177. [1] [2]
- Feldbauer, C., Monaghan, J.J. and Patterson, R.D. (2008). “Continuous estimation of VTL from vowels using a linearly VTL-covariant speech feature.” J. Acoust. Soc. Am., 123, p.3339. [1]
- Fitch, W.T. and Giedd, J. (1999). “Morphology and development of the human vocal tract: A study using magnetic resonance imaging.” J. Acoust. Soc. Am., 106, p.1511-1522. [1]
- Ganchev, T., Fakotakis, N. and Kokkinakis, G. (2005). “Comparative evaluation of various MFCC implementations on the speaker verification task.” Booktitle : Proceedings of the SPECOM. Volume : 1. Organization : Citeseer. OriginalCiteRef : ganchev2005comparative. Pages : 191-194. [1]
- Glasberg, B.R. and Moore, B.C.J. (2002). “A model of loudness applicable to time-varying sounds.” Journal of the Audio Engineering Society, 50, p.331-342. [1]
- Gomersall, P.A., Walters, T.C. and Patterson, R.D. (2005). “Size and temperature information in bullfrog calls.” Howpublished : Poster, British Society of Audiology short papers meeting, Cardiff, UK. OriginalCiteRef : gomersall:2005. [1]
- Gray, H. (1918). Anatomy of the human body. (Lea \& Febiger). [1]
- Huang, X., Acero, A. and Hon, H.W. (2001). Spoken language processing: A guide to theory, algorithm, and system development. (Prentice Hall PTR Upper Saddle River, NJ, USA). [1]
- Huber, J.E., Stathopoulos, E.T., Curione, G.M., Ash, T.A. and Johnson, K. (1999). “Formants of children, women, and men: The effects of vocal intensity variation.” J. Acoust. Soc. Am., 106, p.1532-1542. [1] [2]
- Irino, T., Patterson, R.D. and Kawahara, H. (2006). “Speech segregation using an auditory vocoder with event-synchronous enhancements.” IEEE Trans. Audio, Speech, and Language Process., 14, p.2212-2221. [1]
- Irino, T. and Patterson, R.D. (1997). “A time-domain, level-dependent auditory filter: The gammachirp.” J. Acoust. Soc. Am., 101, p.412-419. [1] [2]
- Irino, T. and Patterson, R.D. (2002). “Segregating Information about the Size and Shape of the Vocal Tract using a Time-Domain Auditory Model: The Stabilised Wavelet-Mellin Transform.” Speech Commun., 36, p.181-203. [1]
- Irino, T. and Patterson, R.D. (2006). “A Dynamic Compressive Gammachirp Auditory Filterbank.” IEEE Transactions on Audio, Speech, and Language Processing, 14, p.2222-2232. [1]
- Ives, D.T., Smith, D.R.R. and Patterson, R.D. (2005). “Discrimination of speaker size from syllable phrases.” J. Acoust. Soc. Am., 118, p.3816-3822. [1] [2]
- Kawahara, H., Masuda-Katsuse, I. and de Cheveigné, A. (1999). “Restructuring speech representations using a pitch-adaptive time-frequency smoothing and an instantaneous-frequency-based F0 extraction: Possible role of a repetitive structure in sounds.” Speech Comm., 27, p.187-207. [1] [2]
- Kawahara, H. and Irino, T. (2004). “Underlying principles of a high-quality speech manipulation system STRAIGHT and its application to speech segregation”, in Speech separation by humans and machines, Divenyi, P.L. editor, p.167-180 (Kluwer Academic). [1]
- Krumbholz, K., Patterson, R.D., Nobbe, A. and Fastl, H. (2003). “Microsecond temporal resolution in monaural hearing without spectral cues?.” J. Acoust. Soc. Am., 113, p.2790-2800. [1]
- Ladefoged, P. and Broadbent, D.E. (1957). “Information Conveyed by Vowels.” J. Acoust. Soc. Am., 29, p.98-104. [1]
- Lee, S., Potamianos, A. and Narayanan, S. (1999). “Acoustics of children's speech: developmental changes of temporal and spectral parameters.” J. Acoust. Soc. Am., 105, p.1455-68. [1]
- Lyon, R.F., Katsiamis, A.G. and Drakakis, E.M. (2010). “History and Future of Auditory Filter Models.” OriginalCiteRef : . Booktitle : IEEE International Symposium on Circuits and Systems, 2010. ISCAS 2007. [1]
- Mermelstein, P. (1976). “Distance measures for speech recognition, psychological and instrumental.” Pattern Recognition and Artificial Intelligence, , p.374-388. [1]
- Mertins, A. and Rademacher, J. (2005). “Vocal tract length invariant features for automatic speech recognition.” Booktitle : 2005 IEEE Workshop on Automatic Speech Recognition and Understanding. OriginalCiteRef : mertins2005vocal. Pages : 308-312. [1]
- Miller, G.A. and Licklider, J.C.R. (1950). “The intelligibility of interrupted speech.” J. Acoust. Soc. Am., 22, p.167-173. [1]
- Monaghan, J.J., Feldbauer, C., Walters, T.C. and Patterson, R.D. (2008). “Low-dimensional, auditory feature vectors that improve vocal-tract-length normalization in automatic speech recognition.” J. Acoust. Soc. Am., 123, p.3066. [1]
- Moore, B.C.J. (2003). An Introduction to the Psychology of Hearing. (Academic Press). [1]
- Patterson, R.D. (1994). “The sound of a sinusoid: Spectral models.” J. Acoust. Soc. Am., 96, p.1409-1418. [1]
- Patterson, R.D. (1994). “The sound of a sinusoid: Time-interval models.” J. Acoust. Soc. Am., 96, p.1419-1428. [1]
- Patterson, R.D., Allerhand, M.H. and Giguère, C. (1995). “Time-domain modeling of peripheral auditory processing: A modular architecture and a software platform.” J. Acoust. Soc. Am., 98, p.1890-1894. [1] [2]
- Patterson, R.D., Robinson, K., Holdsworth, J., McKeown, D., Zhang, C. and Allerhand, M. (1992). “Complex Sounds and Auditory Images”, in Auditory Physiology and Perception, Y Cazals L. Demany and Horner, K. editors (Pergamon Press, Oxford). [1] [2]
- Patterson, R.D., Smith, D.R.R., van Dinther, R. and Walters, T.C. (2008). “Size Information in the Production and Perception of Communication Sounds”, in Auditory Perception of Sound Sources, Yost, W.A., Popper, A.N. and Fay, R.R. editors (Springer Science+Business Media, LLC, New York). [1] [2]
- Patterson, R.D. and Irino, T. (1998). “Modeling temporal asymmetry in the auditory system.” J. Acoust. Soc. Am., 104, p.2967-2979. [1]
- Patterson, R.D. and Moore, B.C.J. (1986). “Auditory filters and excitation patterns as representations of frequency resolution”, in Frequency Selectivity in Hearing, Moore, B.C. editor (Academic Press, London). [1]
- Peterson, G.E. and Barney, H.L. (1952). “Control Methods Used in a Study of the Vowels.” J. Acoust. Soc. Am., 24, p.175-184. [1] [2]
- Purgue, A. (1997). “Tympanic sound radiation in the bullfrog Rana catesbeiana.” Journal of Comparative Physiology A: Neuroethology, Sensory, Neural, and Behavioral Physiology, 181, p.438-445. [1]
- Schreiner, C.E. and Langner, G. (1988). “Periodicity coding in the inferior colliculus of the cat. II. Topographical organization.” J. Neurophysiol., 60, p.1823-. [1]
- Slaney, M. (1993). “Auditory toolbox.” Apple Computer Company: Apple Technical Report, 45, p.. [1]
- Slaney, M., Naar, D. and Lyon, R.F. (1994). “Auditory model inversion for sound separation.” Booktitle : Proceedings of 1994 International Conference on Acoustics, Speech, and Signal Processing. Volume : 2. Organization : Citeseer. OriginalCiteRef : slaney1994auditory. Pages : 77-80. [1]
- Smith, D.R.R., Patterson, R.D., Turner, R.E., Kawahara, H. and Irino, T. (2005). “The processing and perception of size information in speech sounds.” J. Acoust. Soc. Am., 117, p.305-318. [1] [2] [3] [4] [5]
- Smith, D.R.R., Walters, T.C. and Patterson, R.D. (2007). “Discrimination of speaker sex and size when glottal-pulse rate and vocal-tract length are controlled.” J. Acoust. Soc. Am., 122, p.3628-3639. [1] [2] [3]
- Smith, D.R.R. and Patterson, R.D. (2005). “The interaction of glottal-pulse rate and vocal-tract length in judgements of speaker size, sex, and age.” J. Acoust. Soc. Am., 118, p.3177-3186. [1] [2]
- Smith, J.O. and Abel, J.S. (1999). “Bark and ERB bilinear transforms.” IEEE Transactions on Speech and Audio Processing, 7, p.697-708. [1]
- Sprague, M.W. (2000). “The single sonic muscle twitch model for the sound-production mechanism in the weakfish, Cynoscion regalis.” J. Acoust. Soc. Am., 108, p.2430-2437. [1]
- Stevens, S., Volkmann, J. and Newman, E. (1937). “A scale for the measurement of the psychological magnitude pitch.” J. Acoust. Soc. Am., 8, p.185-. [1]
- Turner, R.E., Walters, T.C., Monaghan, J.J. and Patterson, R.D. (2009). “A statistical, formant-pattern model for segregating vowel type and vocal-tract length in developmental formant data.” J. Acoust. Soc. Am., 125, p.2374-2386. [1] [2] [3] [4] [5]
- Turner, R.E. and Patterson, R.D. (2003). “An analysis of the size information in classical formant data: Peterson and Barney (1952) revisited.” Journal of the Acoustical Society of Japan, 33, p.585-589. [1]
- van Dinther, R. and Patterson, R.D. (2006). “Perception of acoustic scale and size in musical instrument sounds.” J. Acoust. Soc. Am., 120, p.2158-76. [1] [2]
- Walters, T.C., Gomersall, P.A., Turner, R.E. and Patterson, R.D. (2008). “Comparison of relative and absolute judgments of speaker size based on vowel sounds.” Proceedings of Meetings on Acoustics, 1, p.1-9. [1] [2]
- Welling, L., Ney, H. and Kanthak, S. (2002). “Speaker adaptive modeling by vocal tract normalization.” IEEE Transactions on Speech and Audio Processing, 10, p.415-426. [1]
- Yost, W.A., Patterson, R. and Sheft, S. (1998). “The role of the envelope in processing iterated rippled noise.” J. Acoust. Soc. Am., 104, p.2349-2361. [1] [2]
- Young, S., Evermann, G., Gales, M., Hain, T., Kershaw, D., Moore, G., Odell, J., Ollason, D., Povey, D., Valtchev, V. and Woodland, P. (2005). The HTK Book. (Microsoft and Cambridge University engineering Department (download from http://htk.eng.cam.ac.uk/)). [1]