File:PUJGn02 fig3.PNG
From CNBH Acoustic Scale Wiki
No higher resolution available.
PUJGn02_fig3.PNG (682 × 518 pixels, file size: 433 KB, MIME type: image/png)
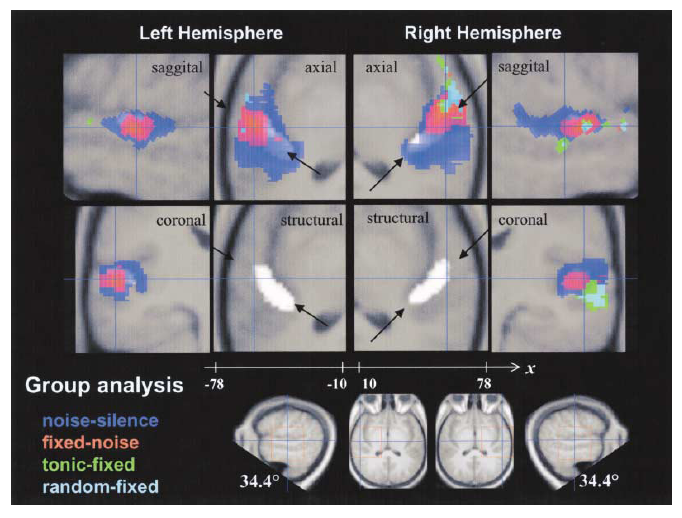
Fig.3: Group activation for four contrasts using a fixed-effects model, rendered onto the average structural image of the group. The height threshold for activation was t=5.00 (p<0.05 corrected). Blue: noise vs silence; Red: fixed pitch vs noise; Green: diatonic melody vs fixed pitch; Cyan: random melody vs fixed pitch. The white highlight shows the position of Heschl's gyrus (HG) (the average of the HG maps for the nine individuals). The arrows show the mid-line of HG separately in each hemisphere. The position and orientation of the sections is illustrated in the bottom panels of the figure. The sagittal sections show front to the left for the left hemisphere and front to the right for the right hemisphere.
File history
Click on a date/time to view the file as it appeared at that time.
| Date/Time | Thumbnail | Dimensions | User | Comment | |
|---|---|---|---|---|---|
| current | 14:36, 10 September 2008 | | 682×518 (433 KB) | AlessandroB (Talk | contribs) |
- Edit this file using an external application (See the setup instructions for more information)
File links
The following 2 pages link to this file: