File:Fig4 2005.PNG
From CNBH Acoustic Scale Wiki
No higher resolution available.
Fig4_2005.PNG (542 × 455 pixels, file size: 27 KB, MIME type: image/png)
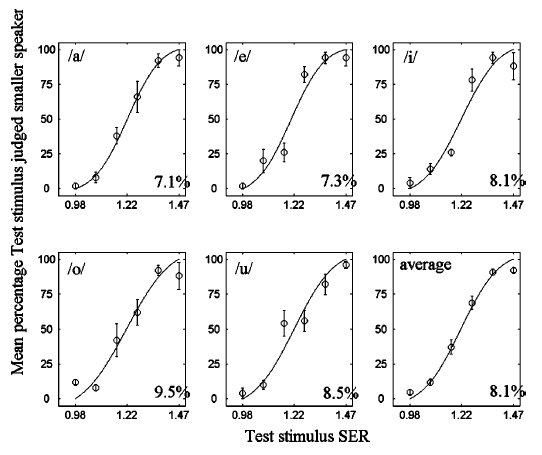
Figure 4. Psychometric functions for speaker-size discrimination in the center of the normal speech range (cf. Fig. 1, 160 Hz, 1.22 SER). Mean percentage of times the test stimulus was judged to be spoken by the smaller speaker, as a function of the SER of the test stimulus. The smooth curves are best-fitting cumulative Gaussians (Foster and Bischof, 1997). The data are shown for each vowel separately, and averaged across all five vowels (bottom-right panel). The means are based on the data of five listeners. Each point on the psychometric function for an individual vowel is based on 50 trials (10 trials from each listener). Error bars show the standard error of the mean. For the data averaged across all five vowels (bottom-right panel), each data point is based on 250 trials (50 trials from each listener). The JND calculated from the fitted curve is shown on the bottom right of each panel.
File history
Click on a date/time to view the file as it appeared at that time.
| Date/Time | Thumbnail | Dimensions | User | Comment | |
|---|---|---|---|---|---|
| current | 15:07, 13 August 2008 | | 542×455 (27 KB) | AlessandroB (Talk | contribs) |
- Edit this file using an external application (See the setup instructions for more information)
File links
The following page links to this file: