Obligatory streaming based on acoustic scale difference
From CNBH Acoustic Scale Wiki
Etienne Gaudrain , Alessandro Binetti, Roy Patterson
This document has been presented at the BSA Short Paper Meeting, 18-19 September 2008, York.
|

|

Contents |
Introduction
The voice of a speaker contains information that helps to identify the speaker and to segregate their voice from those of others in a multi-speaker environment. Specifically, there is information about the size of the speakers vocal folds in their mean glottal pulse rate (GPR) and information about their vocal-tract length (VTL) in the formant frequencies of their vowels. It seems likely that this size information is used to identify and track a target individual in a multi-speaker environment.
Darwin et al. (2003) have reported that GPR and VTL reinforced each other in concurrent sentence reception and raise performance above where it might be expected to be on the basis of either of these components on its own. This observation suggests that for normal combinations of GPR and VTL values, these two factors interact to form a reliable speaker-size estimate that is used to segregate concurrent speakers. The question raised in the current study is whether the mechanism is primitive and automatic, or whether it involves higher-level voluntary cognitive processing.
The technique that Darwin et al. used does not enable us to answer this question. There is, however, an alternative technique involving obligatory streaming, i.e. streaming that cannot be suppressed. Obligatory streaming depicts purely automatic processes that seem to take place in the auditory periphery (Pressnitzer et al., 2008). Obligatory streaming has been studied for a difference in GPR only (Gaudrain et al., 2007), and a difference in VTL only (Tsuzaki et al., 2007), but never for both dimensions together. The aim of the present study is to evaluate whether GPR and VTL perceptual analogs interact in the automatic analysis of auditory scenes.
This interaction would have many implications:
- The GPR is coded in a temporal profile that comes from the temporal analysis of the signal, whereas the VTL is coded in a spectral profile that comes from the tonotopic profile, often called excitation pattern. The interaction of GPR and VTL at a primitive level would mean the interaction of the result of a temporal analysis with a spectral analysis. The dual profile of the stimuli will be used to represent these two profiles in a single graph.
- The GPR and VTL are used to built an estimate of the size of the speaker. If streaming can be proved to be based on speaker-size judgement, then it would mean that size estimation is fully automatic.
- Alternatively, since the physical dimension underlying speaker-size is the acoustic scale (of the source), it is possible that at a primitive level, acoustic scale would be more important than speaker-size.
Method
Acoustic scale and size judgement
For the purpose of the experiment, 4 speakers have to be defined in each condition. Two rules to define these speaker have been used: one based on the acoustic scale, and the other based on the subjective size judgement. The 4 speakers define a rectangle in the GPR-VTL plane. In the current experiments, pairs of speakers were chosen only from the end of the diagonals.
Acoustic Scale condition
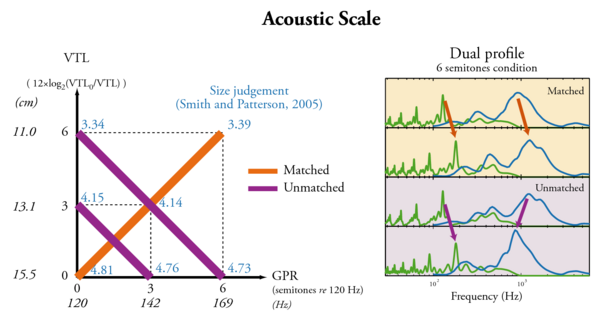
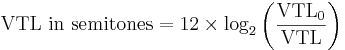
The difference in GPR and VTL can the same when converted in semitones. This results in a consistent change in Acoustic Scale. This condition is described in Figure 1. The VTL difference can be converted to semitones using the following formula 1.
 (1)
(1)
where VTL0 is the VTL of the original voice (15.54 cm). The GPR in semitones, is calculated re 120 Hz, the average GPR of the original voice. The original voice is the voice of the speaker who recorded the syllables.
When both GPR and VTL are changed by the same amount in the same direction, then the scale of the spectral fine structure (GPR) and the scale of the spectral envelope (VTL) move in the same direction. This condition is called Matched. It simulates a consistent change of all the acoustical dimensions of the source. When the GPR and VTL are changed by the same amount, but in opposite directions, then the displacements of the spectral fine structure and of the spectral envelope do not add to form a consistent overall change in acoustic scale. This condition is called Unmatched.
Size Judgement condition
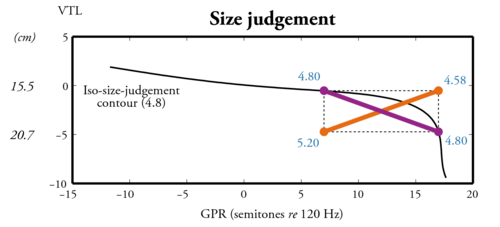
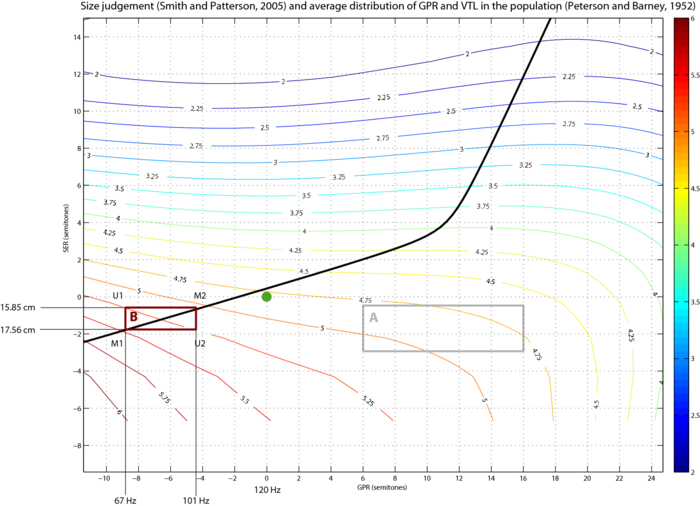
Smith and Patterson (2005) have evaluated the perceived size of vowels for a wide range of GPR-VTL combination. Subjects were asked to judge the size of the speaker on a seven-steps scale ranging from very short to very tall. A two dimensionnal polynomial fitting was used to derive the size judgement data for any combination of GPR and VTL in the tested range. The Size Judgement condition is based on iso-size-judgement contours, i.e. couples of GPR and VTL that yield the same size judgement as illustrated on Figure 2. When two voices are choosen on the same iso-contour, they do not differ in perceived size, and the change in VTL is constrained by the change in GPR. In that case, the change in VTL is compensated by the change in GPR that goes in the other direction, and this is then an Unmatched condition. If the same differences in VTL and GPR are used but in the same direction to produce a Matched condition, then the two speakers differ in size. Two conditions, A and B have been tested. The condition A take benefit from the curvature of the 4.80 iso-contour to have a larger VTL difference. The B condition aims to be centered around the average speaker curve. The two conditions are described in Figure 3.
Table 1 gathers all the VTL and GPR values, perceived size values, and differences in VTL, GPR and perceived size for all the conditions described above.
| Condition | GPR1 | GPR2 | ΔGPR | VTL1 | VTL2 | ΔVTL | Sz1 M | Sz2 M | ΔSz M | Sz1 U | Sz2 U | ΔSz U |
|---|---|---|---|---|---|---|---|---|---|---|---|---|
| Acoustic Scale, 3 semitones | 120 Hz | 142 Hz | 3 sem. | 15.5 cm | 13.1 cm | 3 sem. | 4.81 | 4.14 | 0.67 | 4.15 | 4.76 | 0.61 |
| Acoustic Scale, 6 semitones | 120 Hz | 169 Hz | 6 sem. | 15.5 cm | 11.0 cm | 6 sem. | 4.81 | 3.39 | 1.42 | 3.34 | 4.73 | 1.39 |
| Size Judgement, A | 180 Hz | 320 Hz | 10 sem. | 20.4 cm | 16.0 cm | 4.2 sem. | 5.20 | 4.58 | 0.62 | 4.80 | 4.80 | 0.00 |
| Size Judgement, B | 67 Hz | 101 Hz | 7.1 sem. | 17.56 cm | 15.85 cm | 1.9 sem. | 5.62 | 4.94 | 0.68 | 5.25 | 5.25 | 0.00 |
Streaming paradigms
Delay detection paradigm
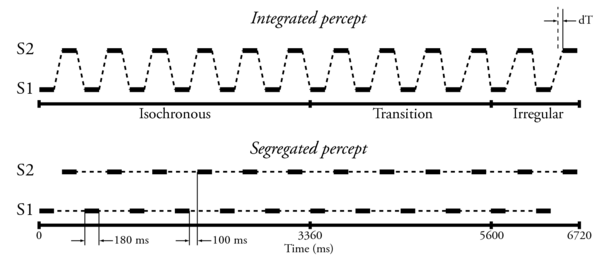
The delay detection paradigm has been introduced by Roberts et al. (2002). The stimulus is a sequence of alternating tones. The beginning of each sequence is isochronous, i.e. the tones emitted by S2 (the upper stream in Figure 4) are centred between the tones emitted by S1. In the present case, tones are syllables, and each syllable is preceded and followed by 100 ms in the isochronous portion. Then comes a transition portion where the tones coming from S2 are progressively delayed up to the third portion where S2 tones are constantly delayed by dT. When the percept is integrated, i.e. the tones coming from S1 and S2 are fused in a single auditory stream, the delay of the S2 tone is relatively easy to detect since it is compared to the previous S1 tone. But when the percept is segregated, then the detection of the delay becomes harder because the time reference is the previous S2 tone. Measuring the detection threshold for this delay provides an objective evaluation of the state of segregation: larger thresholds mean stronger streaming.
The 24 syllables for each sequence used are randomly chosen from a set of 50 (5 vowels: /a, e, i, o, u/ and 10 consonants: /b, d, f, g, h, k, l, m, n, p/). The stimuli are presented in a 3 down-1 up, 2I2AFC procedure to determine the dT which yields 79%-correct on the psychometric function, defined as the detection threshold. The procedure of Roberts et al. (2002) has been adapted to the syllables. Notably, the duration of the items have been substantially increased (180 ms), and so has been the duration of the silence between each item (100 ms). This paradigm has been use for the Acoustic Scale condition only.
Possible issue to the adaptation to speech: the onset of the syllable varies with the consonant and generally less clearly defined than for a pure or complex tone. That's why the silence has been increased between the items. This is somewhat attenuated by the fact that the judgement occurs on a number of pairs that involve different consonants. However, extra-care might be taken by building the sequences considering the importance of the last consonants.
Repeated syllable paradigm
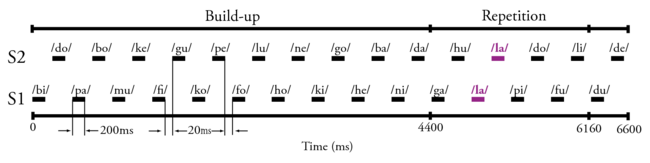
This paradigm, presented in Figure 5, has been inspired by Christophe Micheyl. A sequence of syllables, alternatively pronounced by two speakers S1 and S2, presents one, and only one, repetition. This repetition is across the speakers, i.e. the repeated syllable is pronounced by one speaker, and just after by the other speaker. If the percept is integrated, i.e. no streaming, the repetition is obvious. On the contrary if the percept is segregated, then the repetition is fairly hard — or even impossible — to detect. The task is then simply to report the repeated syllable. The parameters used for this specific experiment are reported in Figure 5.
Results
|
|
Attention! These are preliminary results of a pre-experiment... Do not jump to any conclusion from this. |
Delay detection and Acoustic Scale
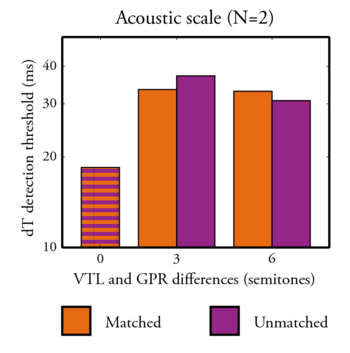
The results are presented in Figure 6. The paradigm effectively produced a difference between the control condition (no difference in GPR nor in VTL), and the other conditions (3 and 6 semitones). This difference is due to the fact that segregation occurs in the latter conditions. Roberts et al. (2002) found thresholds about 2.5 times bigger than the in the control condition when streaming occured, and we find here thresholds about 2 times bigger than in the control condition. We have more build-up time, but the tempo is a lot slower, and time judgement may be hindered by smooth syllable onsets.
Given the current number of subjects and repetitions, no statistical analysis can be performed. These preliminary results seem to indicate that there is no difference between the Matched and Unmatched conditions. This could be due to some saturation effect as suggested by the fact that there is roughly no difference between the 3 semitones and 6 semitones conditions. However, the upper limit for the threshold is 100 ms and the longuest threshold measured here is smaller than 40 ms. A saturation effect can then very probably ruled out (except if there is a second order effect due to the fact that the tempo is changed locally when a delay is introduced, and is local change could affect streaming). This would suggest that the acoustic scale of the whole source is not used in streaming, and that the temporal profile and the spectral profile contributions to streaming remain independant.
However, it is not clear what the acoustic scale of the source become in the Unmatched condition. Also, it is possible that the auditory system is more used to analyse human voice and therefore certain combination of GPR and VTL that would be relevant in such sources. As displayed in Table 1, the perceived size difference in the Matched (0.67 or 1.42) and Unmatched (0.61 or 1.39) conditions are practically the same. This means that if streaming can be based on a perceived speaker-size difference, the amount of streaming induced here would be the same in the Matched and Unmatched conditions.
Repeated syllable and Size Judgement
As described before, two conditions were used here. The results for the two conditions are plotted in Figure 7. The first bar of the left panel of Figure 7 shows the performance of identification of the repeated syllable when the two speakers are identical to the original speaker: 100%-correct. The results in the condition A are much lower (around 25%) showing that it becomes very difficult to perceive the repeated syllable when the speakers are very different. However these performances are too close to the chance level. Any result in this region could be due to a flooring effect preventing any difference between the Matched and Unmatched conditions to be perceived. This is the reason why another condition was chosen. The condition B was chosen in order to reduce the effect of streaming to obtain results in the mid range where sensitivity should be maximal. Also the voices used in the condition A were all odd voices, as denoted by there distance to the "normal speaker" curve in the Figure 3.
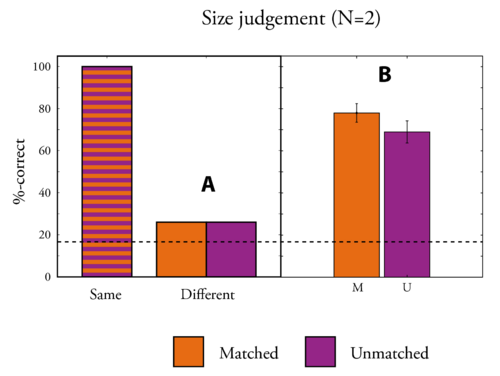
In the condition B, the results are between 60% and 80%, which might still be a bit to high. However, the results now show a difference between the Matched and Unmatched condition: there seems to be more streaming in the Unmatched condition than in the Matched condition. This somewhat unexpected result can find at least to explanations:
- The streaming could be based preferentially on "voice weirdness" instead of size. The two voices with same size are further apart from the "normal-speaker" curve than the speakers of the Matched condition.
- The identification perfomances are different in the two conditions. Smith et al. (2005) observed recognition performance for long (>500ms) isolated vowels. The interpolated recognition scores for each of the 4 speakers used in the condition B (see Figure 3) are: U1 98.5%, U2 95.5%, M1 97.5%, M2 97.0%. So all these results are very close to 100% and, in average, there is not a much a difference between the Matched (97.3%) and Unmatched (97.0%) conditions. So one might not expect any influence of this one our results. However, this recognition performance was measured for isolated vowel, i.e. without distraction, and with long vowels. The outcome could be different for short syllables in a sequence and the very slight difference observed here could become significant.
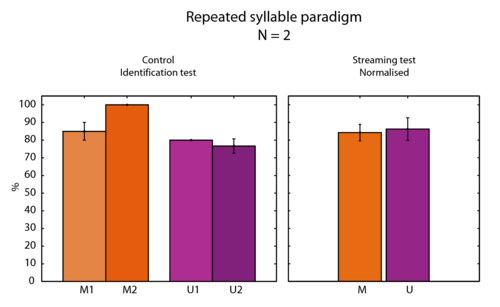
To test for this latter hypothesis, the same paradigm of Repeated syllable detection was used in four conditions. In each condition, the two speakers were the same so that no streaming was induced by a speaker difference. The 4 speakers described in Figure 3 for the condition B were used: U1, U2, M1, M2. The results are displayed in the left panel of Figure 8.
The average score is 100% for only speaker: M2. The other speakers yield score around 80%-correct, significantly below the scores found by Smith et al. (2005). The right panel of Figure 8 shows the scores in the streaming test normalised with these identification results. It seems that no difference between the Matched and Unmatched condition remains after normalisation. The identification seems then to account for most of the difference shown in Figure 7.
Discussion
This section describes the pitfalls of the current pre-experiment and propositions to avoid them.
- The results in the condition B are still a bit too high and we are missing the maximum sensitivity point. More streaming could easily be produced by enlarging the rectangle.
- The identification should always be controlled, and if necessary, the results should be normalised. However it would be better if identification could be perfect for all speakers (or at least the same). Is seems likely that when a speaker is far from the original speaker in the GPR-VTL plane, it tends to yield more reduced identification. In our results, M2 produces 100%-correct identification, and is the closest speaker to the original speaker. One solution could be to choose a rectangle centred on the original speaker.
- One explanation for the current result could be that the VTL difference is too small. Tsuzaki et al. (2007) have observed only little obligatory streaming for a difference in VTL of 1/4 octave, i.e. 3 semitones. It would then have no influence on streaming and the Matched and Unmatched condition would then be the same. The VTL difference should then be increased to induce streaming, and tested alone (M1-U1 and M2-U2).
- However, increasing VTL would constraint to a huge GPR difference given the conversion ratio between GPR and VTL (see the slope of the iso-contours in Figure 3). This can be fixed if the GPR is scrambled. In normal speech, the GPR contour range is about half an octave. The GPR could then be jittered along the sequence (with a low enough frequency), so that: GPR based streaming would actually occur on the basis of mean GPR, as it is probably the case in real situations.
- Acoustic scale vs. Size judgement. It is not clear yet if need the two conditions. Acoustic Scale intends to hold an "acoustically consistent" change, which would fit nicely with the fact that streaming is a primitive mechanism: only basic acoustic features can be processed at this level. However, obviously, the size of a speaker influences both GPR and VTL in a non-linear way as illustrated by the Peterson and Barney (1952) data in Figure 3. So the Acoustic Scale condition may not have much sense finally. Also, if the rectangle that defines the 4 speakers is closer to the original voice, and the VTL difference is larger, it may be difficult to keep U1 and U2 exactly on an iso-contour. So they will probably be a bit off the contour, and the Size Judgement condition will be a bit closer to the Acoustic Scale condition.
Acknowledgements
We want to thank David R. Smith for kindly providing the data presented in Smith and Patterson (2005) and Smith et al. (2005).
Other versions of this article
References
- Darwin, C.J., Brungart, D.S. and Simpson, B.D. (2003). “Effects of fundamental frequency and vocal-tract length changes on attention to one of two simultaneous talkers.” J. Acoust. Soc. Am., 114, p.2913-2922. [1] [2]
- Gaudrain, E., Grimault, N., Healy, E.W. and Béra, J.-C. (2007). “Effect of spectral smearing on the perceptual segregation of vowel sequences.” Hear. Res., 231, p.32-41. [1]
- Peterson, G.E. and Barney, H.L. (1952). “Control Methods Used in a Study of the Vowels.” J. Acoust. Soc. Am., 24, p.175-184. [1] [2]
- Pressnitzer, D., Sayles, M., Micheyl, C. and Winter, I.M. (2008). “Perceptual organization of sound begins in the auditory periphery.” Curr. Biol., 18, p.1124-8. [1]
- Roberts, B., Glasberg, B.R. and Moore, B.C.J. (2002). “Primitive stream segregation of tone sequences without differences in fundamental frequency or passband.” J. Acoust. Soc. Am., 112, p.2074-2085. [1] [2] [3] [4]
- Smith, D.R.R., Patterson, R.D., Turner, R.E., Kawahara, H. and Irino, T. (2005). “The processing and perception of size information in speech sounds.” J. Acoust. Soc. Am., 117, p.305-318. [1] [2] [3]
- Smith, D.R.R. and Patterson, R.D. (2005). “The interaction of glottal-pulse rate and vocal-tract length in judgements of speaker size, sex, and age.” J. Acoust. Soc. Am., 118, p.3177-3186. [1] [2] [3] [4]
- Tsuzaki, M., Takeshima, C., Irino, T. and Patterson, R.D. (2007). “Auditory stream segregation based on speaker size, and identification of size-modulated vowel sequences”, in Hearing - From Sensory Processing to Perception, Kollmeier, B., Klump, G., Hohmann, V., Langemann, U., Mauermann, M., Uppenkamp, S. and Verhey, J. editors, p.285-294 (Springer). [1] [2]