File:Fig9 DPjasa06.PNG
From CNBH Acoustic Scale Wiki
No higher resolution available.
Fig9_DPjasa06.PNG (604 × 589 pixels, file size: 24 KB, MIME type: image/png)
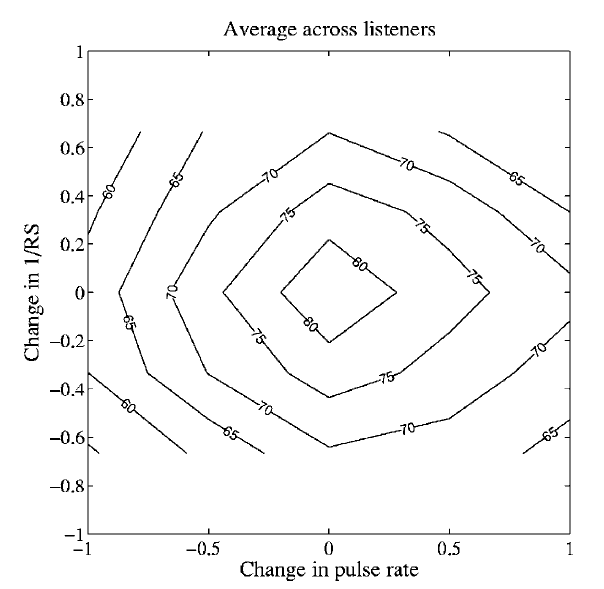
Figure 9. Contours showing the percent-correct instrument recognition as a function of the change in PR and RS, averaged over all conditions, instruments and listeners. The data are plotted on a base-2 logarithmic axis for both the change in PR (the abscissa) and the change in RS (the ordinate).
File history
Click on a date/time to view the file as it appeared at that time.
| Date/Time | Thumbnail | Dimensions | User | Comment | |
|---|---|---|---|---|---|
| current | 15:26, 14 August 2008 | | 604×589 (24 KB) | AlessandroB (Talk | contribs) |
- Edit this file using an external application (See the setup instructions for more information)
File links
The following page links to this file: