The interaction of vocal tract length and glottal pulse rate in the recognition of concurrent syllables
From CNBH Acoustic Scale Wiki
|

In concurrent speech recognition, performance is enhanced when either the glottal pulse rate (GPR) or the vocal tract length (VTL) of the target speaker differs from those of the distracter, but relatively little is known about the trading relationship between the two variables, or how they interact with other cues such as degree of spectro-temporal overlap. This paper presents a study in which listeners were asked to identify a target syllable in the presence of a distracter syllable, when the temporal envelopes of the syllables were carefully matched. The syllables varied in GPR and VTL over a large range, and they were presented at different signal-to-noise ratios (SNRs). Each combination of GPR, VTL and SNR was presented 40 times without feed-back. The results showed that performance is particularly sensitive to the combination of GPR and VTL when the SNR is 0 dB. Equal-performance contours showed that a two semitone (ST) difference in GPR produced the same advantage in performance as a 25% difference in VTL. Beyond differences of this magnitude (2 ST and 25%), there was little further improvement in performance as the speaker differences were increased.
PACS numbers: 43.71.Bp 43.71.An, 43.66.Ba
Contents |
Introduction
In multi-speaker environments, listeners need to attend selectively to the target speaker in order to segregate their speech from distracting speech sounds uttered by other speakers. This paper is primarily concerned with two speaker-specific acoustic cues that listeners use to segregate concurrent speech: glottal pulse rate (GPR) and vocal tract length (VTL). Brungart (2001) reported an intriguing study in which the target and distracting speakers were either the same sex or different sex. He used sentences and showed that listeners were better at identifying concurrent speech when the competing voices came from different speakers. Darwin et al. (2003) investigated the combined effects of GPR and VTL on source segregation by synthesizing sentences to simulate different speakers. They showed that a large performance advantage was derived from a combined difference in GPR and VTL. In these and other studies, where the speech stimuli are presented in sentences, it is not possible to match the temporal envelopes of the competing speech sounds. As a result, listeners can monitor the concurrent speech for clean segments of the target speech and string the segments together – a process that Cooke (2006) refers to as ‘glimpsing’ by analogy with vision. The purpose of the current study was to investigate the interaction of GPR and VTL in concurrent syllables with carefully matched temporal envelopes. When the temporal envelopes are matched, the listeners cannot take advantage of glimpsing, and performance differences can therefore be used to study the effects of vocal characteristics of the competing voices.
Acoustic cues for segregating concurrent speech
The most significant cue for speech segregation is almost undoubtedly audibility, which is determined by the signal to noise ratio (SNR). When the speech material is sentences and they are matched for overall SNR, there nevertheless are momentary fluctuations in SNR that allow the listener to hear the target clearly. Miller and Licklider (1950) reported that listeners are capable of detecting segments of the target speech during relatively short minima in temporally fluctuating background noise. Cooke (2006) used a missing-data technique to model this effect and called it glimpsing. He concluded that a glimpsing model can account for the intelligibility of speech in a wide range of energetic masking conditions. Vocal characteristics such as GPR and VTL also provide cues that support detection of the target speech. GPR is largely heard as voice pitch, and VTL provides an auditory cue to the size of the speaker (Smith and Patterson, 2005). A lot of research has been concerned with the role of pitch (e.g., Chalikia and Bregman, 1993; Qin and Oxenham, 2005; Assmann and Summerfield, 1990; Assmann and Summerfield, 1994; Culling and Darwin, 1993). The experiments reported here focused on the effects of GPR and VTL and their interaction, while the other acoustic cues were either controlled or omitted. There are also spatial location cues (interaural time and intensity differences) which can assist listeners in segregating concurrent speech (Drennan et al., 2003; Culling and Summerfield, 1995; Ihlefeld and Shinn-Cunningham, 2008), but they are not part of the current study.
The role of vocal characteristics in speech segregation
The role of pitch in concurrent speech has been investigated in many psychophysical studies, and in many cases the pitch is specified in terms of the fundamental (F0) of the harmonic series associated with the GPR. Chalikia and Bregman (1993) used concurrent vowels to show that a difference in F0 leads to better recognition of both vowels. Furthermore, they showed that a difference in F0 contour can lead to better recognition in situations where the harmonicity of the constituents is reduced. Assmann and Summerfield (1994) used concurrent vowels to show that small departures, from otherwise constant F0 tracks, can improve vowel recognition, especially when the F0 difference is small. Qin and Oxenham (2005) used concurrent vowels to show that performance reached its maximum when the difference in F0 was about 4 semitones (STs). They also found that when the spectral envelope was smeared with a channel vocoder, an F0 difference no longer improved vowel recognition. Summerfield and Assmann (1991) have argued that the advantage of an F0 difference derives from the difference in pitch per se and not from the difference in spectral sampling of the formant frequencies, or glottal pulse asynchrony. In a series of related experiments, de Cheveigné and colleagues developed a harmonic cancellation model tuned to the periodicity of the distracter (de Cheveigné et al., 1997b; de Cheveigné et al., 1997a; de Cheveigné, 1997; de Cheveigné, 1993). They showed that the advantage of an F0 difference in double-vowel recognition depends primarily on the harmonicity of the distracter. Culling and Darwin (1993) showed that when F0 tracks of concurrent speech are ambiguous, listeners can use the formant movements of competing diphthongs to disambiguate concurrent speech. They showed that listeners were only able to judge whether the F0 tracks of the speakers crossed or bounced off each other when the constituents had different patterns of formant movement.
When the F0 difference is small or the pitch is otherwise ill-defined, listeners have to use other acoustic cues to segregate concurrent speech. Brungart (2001) used noise and speakers of different sex as distracters in a concurrent speech experiment. The distracting speech came from (a) the same speaker, (b) a different speaker of the same-sex, or (c) a speaker of the opposite sex. Performance was measured with the Coordinate Response Measure (CRM) that consists of sentences in the form: "Ready /call-sign/ go to /color/ /number/ now," where /call-sign/ is a name like Charlie or Ringo (Bolia et al., 2000; Moore, 1981). Brungart found that the psychometric functions for noise and speech distracters had different shapes. A clear performance advantage was observed when the distracter was a different speaker from the target, and the biggest advantage arose when the distracter was of a different sex. For all of the speech distracters, the worst performance was at 0 dB SNR; at negative SNR, performance recovered somewhat. For noise maskers, performance was better overall, and no recovery was found for negative SNR. The results were interpreted in terms of informational masking, and they suggest that voices are more distracting than noise even when the noise is modulated. However, the release from masking at negative SNR only occurred for identification of the color coordinate in the target sentence. Brungart speculated that this might be because the numbers appear last in the CRM sentences and so might not overlap in time as much as the color coordinates. Thus, more glimpsing was possible with the numbers than with the colors. This might explain the morphological difference between the psychometric functions for color and number. Glimpsing could also explain the relative inefficiency of the noise masker in that study. In Brungart et al. (2001), similar results were found for multiple distracting speakers except for the recovery phenomenon indicating that it probably is to do with the extent to which words overlap in CRM.
Darwin et al (2003) investigated the effects of F0 and VTL in a study on concurrent speech using the CRM corpus. They used a pitch-synchronous overlap-add (PSOLA) technique to manipulate F0 and VTL. For an F0 difference of 12 ST, at 0dB SNR, they reported an increase in speech recognition of 28%, most of which (~20%) was already apparent at an F0 difference of 4 ST (see Fig. 1 in Darwin et al., 2003). They also found that individual differences in intonation can help identify speech of similar F0, corroborating the findings of Assmann and Summerfield (1994) mentioned above. For a 38% change in VTL, Darwin et al. reported an increase in recognition of ~20% at 0 dB SPL (see Fig. 6 in Darwin et al., 2003). The largest performance increase was found for a combined difference in GPR and VTL, and they concluded that F0 and VTL interact in a synergistic manner. However, a large asymmetry was reported with regard to the effect of VTL. When the VTL of the target was smaller than the VTL of the distracter, the effect was much larger than when the VTL of the target was larger than the VTL of the distracter (by the same relative amount). As in the study of Brungart (2001), they made no attempt to control glimpsing.
In two related studies involving a lexical decision task, Rivenez and colleagues showed that differences in both F0 and VTL between two competing voices presented dichotically facilitated the use of priming cues in an unattended contralateral signal (Rivenez et al., 2006; Rivenez et al., 2007). In both their studies, an advantage was observed in terms of faster response time to the target stimuli, and the results were interpreted to lend support to the notion that an early perceptual separation of the competing voices is a necessary prerequisite for lexical processing of the unattended voice.
The results described above suggest that listeners construct a model of the target and distracting speakers and they use speaker-specific acoustic cues (such as VTL and GPR) as part of the model. Smith and Patterson (2005) showed that listeners can judge the relative size/age, and the sex of a speaker based on their vowels even when the GPR and VTL were well beyond the range of normal speech. Collins (2000) showed that female listeners can make accurate judgments about the weights of male speakers based on their voice alone. It has been suggested that speaker size information (some correlate of VTL) is extracted automatically (Irino and Patterson, 2002) as the auditory system constructs a size-invariant representation of the message of the speech. In the current paper, it is argued that listeners use the size information in their speaker models and that this facilitates the segregation of competing voices. We hypothesize that the reason why it is possible to attend selectively to a particular speaker in a multi-speaker environment is that the processing of VTL and GPR cues is automatic and occurs at an early point in the hierarchy of speech processing. In natural speech, speakers vary GPR by changing the tension of the vocal cords, and they use GPR to convey prosody information within a range determined largely by the anatomical constitution of the laryngeal structures (Titze, 1989; Fant, 1970). By contrast, it is only possible to change VTL by a small amount, either by pursing the lips or by lowering or raising the larynx, which require training, and both of which produce an audible change to the quality of the voice. The relative stability of the VTL cue suggests that it is likely to be at least as important for tracking as GPR.
The purpose of the current study was to investigate the relative contribution of GPR and VTL in the recognition of concurrent speech, whilst carefully controlling other potential cues. The aims were (1) to quantify the effects of VTL and GPR, and (2) to model the trading relationship between them.
Method
The participants were required to identify syllables spoken by a target speaker in the presence of a distracting speaker, and performance was measured as a function of the difference between the target and distracting speakers along three dimensions: GPR, VTL and SNR. In order to prevent the listeners taking advantage of temporal glimpses, the temporal envelopes of target and distracter syllables were carefully matched.
Stimuli
The experiment was based on the syllable corpus previously described by Ives et al. (2005) and von Kriegstein et al. (2006). It consists of 180 spoken syllables, divided into consonant-vowel (CV) and vowel-consonant (VC) pairs. There were 18 consonants, 6 of each of 3 categories (plosives, sonorants <ref name="footnote1">The category sonorant here refers to a selection of consonants from the manner classes: nasal, trill and approximant (sometimes called semivowel) that are common in the English language ([m], [n], [r], [j], [l], [w]).</ref> and fricatives), and each of the consonants was paired with one of 5 vowels spoken in both CV and VC combinations. The syllables were analyzed and resynthesized with a vocoder (Kawahara and Irino, 2004) to simulate speakers with different combinations of GPR and VTL. Since all the voices were synthesized from a recording of a single speaker (RP), the only cues available for perceptual separation were the GPR and VTL differences introduced by the vocoder. Throughout the experiment the target voice was presented at 60 dB SPL, while the RMS level of the distracting voice varied to achieve an SNR of + 6 dB, 0 dB, or – 6 dB.
Vocal characteristics
The voice of the target speaker remained constant throughout the experiment; its characteristics were chosen with reference to typical male and female voices. Peterson and Barney (1952) reported that the average GPRs of men and women are 132 Hz and 223 Hz, respectively, and Fitch and Giedd (1999) reported that the average VTLs of men and women are 155.4 mm and 138.8 mm, respectively. The geometric means of these values were used to simulate an androgynous target speaker with a GPR of 171.7 Hz and a VTL of 146.9 mm. The VTL of the original speaker was estimated to be 165 mm, and this value was used as the reference length from which to rescale VTL to produce the distracter voices. The combinations of GPR and VTL chosen for the distracter are shown by the dots in Figure 1, which form an elliptical spoke pattern radiating out across the GPR-VTL plane from the reference speaker. The ellipse that joins the ends of the spokes had a radius of 26% (4ST = 24 / 12) along the GPR axis and 41% (6ST = 26 / 12) along the VTL axis. The VTL dimension is proportionately longer because the just noticeable difference (JND) for VTL is at least 1.5 times the JND for GPR (Ives et al., 2005; Ritsma and Hoekstra, 1974). There were seven points along each spoke, spaced logarithmically in this logGPR-logVTL plane in order to sample the region of the target speaker with greater resolution. The spokes were numbered in the anti-clockwise direction. The reference spoke, 1, was tilted down by 12.4 degrees so that the line formed by spokes 1 and 5 lies along the line joining the average man with the average woman (Turner et al., 2004; Peterson and Barney, 1952; Fitch and Giedd, 1999). This has the further advantage of ensuring that there was always variation in both GPR and VTL between the target and distracter voices. In all, there were 56 different distracter voices with the vocal characteristics shown in Table I.

Table I. Vocal characteristics of the distracter voice. Point refers to the position on the spokes in Figure 1 ascending outwards from the reference speaker in the centre.
| Spoke | Point: | 1 | 2 | 3 | 4 | 5 | 6 | 7 |
| 1 | GPR (Hz) | 170.9 | 168.6 | 164.7 | 159.5 | 153.0 | 145.5 | 137.0 |
| VTL (cm) | 14.7 | 14.8 | 14.9 | 15.1 | 15.3 | 15.5 | 15.8 | |
| 2 | GPR (Hz) | 171.3 | 170.0 | 167.8 | 164.9 | 161.1 | 156.7 | 151.6 |
| VTL (cm) | 14.8 | 15.0 | 15.5 | 16.2 | 17.0 | 18.2 | 19.7 | |
| 3 | GPR (Hz) | 171.9 | 172.4 | 173.3 | 174.5 | 176.1 | 178.1 | 180.4 |
| VTL (cm) | 14.8 | 15.1 | 15.6 | 16.4 | 17.5 | 18.8 | 20.6 | |
| 4 | GPR (Hz) | 172.4 | 174.5 | 178.0 | 183.0 | 189.6 | 198.1 | 208.6 |
| VTL (cm) | 14.7 | 14.9 | 15.2 | 15.6 | 16.2 | 16.8 | 17.7 | |
| 5 | GPR (Hz) | 172.5 | 174.9 | 179.0 | 184.8 | 192.7 | 202.7 | 215.2 |
| VTL (cm) | 14.7 | 14.6 | 14.5 | 14.3 | 14.1 | 13.9 | 13.6 | |
| 6 | GPR (Hz) | 172.1 | 173.5 | 175.7 | 178.8 | 183.0 | 188.1 | 194.5 |
| VTL (cm) | 14.6 | 14.3 | 13.9 | 13.4 | 12.7 | 11.9 | 11.0 | |
| 7 | GPR (Hz) | 171.5 | 171.0 | 170.1 | 168.9 | 167.4 | 165.6 | 163.4 |
| VTL (cm) | 14.6 | 14.3 | 13.8 | 13.2 | 12.4 | 11.5 | 10.5 | |
| 8 | GPR (Hz) | 171.0 | 169.0 | 165.7 | 161.1 | 155.5 | 148.8 | 141.3 |
| VTL (cm) | 14.6 | 14.5 | 14.2 | 13.8 | 13.4 | 12.8 | 12.2 |
An assumption underlying the design is that there is a trading relationship between VTL and GPR in the perceptual separation between the target voice and any distracter voice, and that the perceptual distance can be expressed by the Radial Scale Displacement (RSD) between their points in the logGPR-logVTL plane. The RSD is the geometrical distance between the target and distracting voices:

where X is log(GPR), Y is log(VTL) and χ is the GPR-VTL trading value that is 1.5 in the design. The GPR and VTL values shown in Figure 1 are for RSD1.5 . The design only requires the trading value to be roughly correct; so long as the voices vary in combination over ranges that go from indistinguishable to readily distinguishable in all directions, then the optimum trading value can be estimated from the recognition data, as illustrated in the Results.
Envelope control
A combination of techniques was employed to limit glimpsing. First, the perceptual centers (Marcus, 1981) of the syllables were aligned as described by Ives et al. (2005). Second, the target and distracter syllables were matched according to their phonetic specification in the following way: (1) the consonant-vowel order of the target and distracter syllables was always the same, and (2) the consonants in a concurrent pair of target and distracter syllables were always from the same category. The result of these manipulations is that the envelopes of the target and distracter syllables were closely aligned and quite similar in shape, as illustrated in Figure 2. Within the six categories, the target and distracter syllables were chosen at random with the restriction that the pair never contain either the same consonant or the same vowel. This restriction leaves 20 potential distracter syllables for each target syllable.

Procedure
The study consisted of three parts: (1) pre-experimental training, (2) the main experiment, and (3) an SNR extension. The procedure was the same in all three: The target syllables were presented in triplets; the first syllable was provided to specify the GPR and VTL of the target speaker; the second and third syllables were test syllables presented with a concurrent distracter syllable. As each syllable was played, its interval was highlighted on a computer screen as shown in Figure 3. After the third interval was complete, the box for interval 2 or 3 – chosen at random – was illuminated to indicate which of the two target syllables the listener was required to identify. They indicated their answer by clicking on the orthographical representation of the syllable in the response grid on the screen. The participants were seated in front of the computer screen in a double-walled IAC sound-attenuated booth, and the stimuli were presented via AKG K240DF headphones.

Pre-experimental training
The ambiguity of English orthography meant that the response grid shown in Figure 3 required some introduction. Listeners had to learn that the vowels were annotated in pan-European style, in which "a" is [ɑː], "e" is [ɛː], "i" is [іː], "o" is [oː] and "u" is [uː], and they had to learn to navigate their way around the response grid. In the first training session, target syllables without distracters were presented to the listeners who were instructed to respond to the sound in interval 3. This training comprised 15 runs of 40 trials with visual feedback. Each run was limited to a subset of the syllable database in order to gradually introduce the stimuli and their orthography. Then followed 360 trials of target syllables without distracters and without visual feedback. In a second training session, the distracters were gradually introduced and both intervals 2 and 3 were used as test intervals. There were 10 runs of 48 trials in this session with visual feedback. During training, performance criteria were used to ensure that the listener reached an acceptable level of performance before proceeding to the next stage. If the listener did not meet the criterion on a particular run, it was repeated until performance reached criterion. The pass marks were set based on pilot work; they ranged from 80 percent correct for sets of target syllables without distracters down to as little as 30 percent correct when distracters were included and the SNR was -9 dB. All of the listeners passed all the training runs with, at most, 3 presentations. In total, the listeners did, at least, 1030 trials before commencing the main experiment, by which time they were sufficiently proficient in the use of the graphical interface.
Main Experiment
In the main experiment, recognition performance was measured as a function of GPR, VTL and SNR for the CV syllables only. There were 56 different distracter voices (cf. Figure 1 and Table I) and 3 SNRs (-6 dB, 0 dB, 6 dB). The RSD between the target and distracter voices was varied over trials in a consistent fashion, from large to small and back to large. In this way, the task became progressively harder and then easier in an alternating way such that the listener was never subjected to a long sequence of difficult trials with small RSD values. The conditions at the ends of the RSD dimension were not repeated as the oscillation proceeded, so one complete cycle contained 12 trials.
The main experimental variable – the combination of GPR and VTL in the distracter voice – was varied randomly without replacement from the eight values with the current RSD value (one on each spoke). The main experiment consisted of 120 runs of 48 trials (four cycles as explained above). Between runs, the SNR cycled through the three SNR values. The combination of RSD oscillation and controlled spoke randomization meant that when all runs had been completed all of the RSD values, other than the end-points had been sampled 40 times at each SNR, and the end-points had been sampled 20 times.
SNR extension
The final part of the study measured psychometric functions for six distracters at SNR values of -15, -9, 0, +9 and +15 dB using an up-down procedure. Four of the distracters were the outermost points of spokes 1, 3, 5 and 7 marked with circles in Figure 1. The remaining two distracters were the target voice itself and a noise masker. The noise maskers were created by extracting the temporal envelopes of distracters chosen in the usual way, and then filling the envelopes with speech-shaped broadband noise (Elberling et al., 1989). Randomization was performed so that after 24 runs of 40 trials each, all mid-points in the SNR range had been measured 40 times for each distracter.
Results
An overview of the results is presented in Figure 4 in the form of three surfaces that show syllable-recognition performance as a function of GPR and VTL, separately for the three SNRs (+6 dB, 0 dB and -6 dB). The surfaces provide a descriptive summary of the data, and the technique for fitting the surfaces to the data is described below after this brief overview. The dotted lines in the GPR-VTL plane show the combinations of GPR and VTL that defined the distracters. The main effect of SNR is illustrated by the displacement of the surfaces around their outer edges, where the radial distance between the target and distracter is maximum; the average performance for the largest speaker difference was 77%, 64% and 52% when the SNR was +6 dB, 0 dB and -6 dB, respectively. The effect of speaker difference is illustrated by the indentation at the centre of each surface. In each case, as the radial distance between the target and distracter voice decreases, recognition performance decreases, and in each case, the worst performance occurs when there is minimal difference between the target and distracter in terms of GPR and VTL, as would be expected. Although the three surfaces have quite similar shapes, there is an interaction with SNR. The average performance at the centre of the surface drops 16% when the SNR is +6 dB, 29% when SNR is 0 dB and 20% when the SNR is -6 dB; that is, the drop in performance is greatest when there is no level difference between target and masker. There is a strong interaction between the effects of GPR and VTL that takes the form of a relatively simple tradeoff. If the two variables are described in logarithmic units (as shown in Figure 1), then a change in VTL has to be almost twice the change in GPR to have the same effect on performance. In other words, for a given level of performance, each GPR-VTL contour is an ellipse whose major and minor axes are aligned with the GPR and VTL dimensions, respectively, and the length of the major axis of the ellipse (GPR) is approximately half the length of the minor axis of the ellipse (VTL). The radial profile of the surface is a cumulative gamma function; the details of this model are described below in section III. B.1.

Effect of SNR
A different view of the effect of SNR is presented in Figure 5, which shows the psychometric functions for the noise masker and the speech distracters (solid lines). The speech distracters were either the four speakers furthest from the target voice (Different voices) or the target voice itself (Identical voice). The average recognition drops from between 78% and 88% at 15 dB SNR to between 17% and 34% at -15 dB SNR; the largest drop is seen for the noise masker. The dashed lines show target-distracter confusions, that is, the percent of trials on which the listeners reported the distracter rather than the target.

With the exception of the case where the distracter was identical to the target, recognition performance for speech distracters did not vary with the spoke of the speaker, that is, the position in the GPR-VTL plane. This supports the hypothesis that the vector distance from the target speaker to other speakers in the plane (the RSD) reflects the perceptual distance between the voices. Performance with speech distracters that differ in vocal characteristics from the target is always better than performance when the distracter has the same vocal characteristics, even when the SNR is large. In the region of 0 dB SNR, the gradient is steepest for the noise masker; performance drops about 3%/dB. The noise distracters had temporal envelopes that were matched to the envelopes of the syllables but they have no phonemic content, and so the psychometric function for the noise distracter can be considered a baseline for energetic masking. In other words, the noise distracter is a masker in the traditional sense. The worst performance was found for the condition in which the vocal characteristics of the distracter were identical to those of the target. This is hardly surprising, but this condition illustrates the effect of loudness; for large SNR, performance with the identical speech distracter is similar to the noise distracter. Because the target and distracter voices are identical, the only cue available to the listener is the difference in loudness. To solve the task, the listener needs to track the target voice through interval 3 based on the loudness of the precursor in interval 1, relative to the loudness of the distracters in intervals 2 and 3. As the loudness difference becomes smaller, performance drops off more than for the noise masker – down to 40 % at 0 dB SNR. At negative SNRs, the difference in performance between the noise masker and the identical speech distracter disappears as the effect of the distracter level increases.
Occasionally, listeners reported the distracter syllable rather than the target syllable. This is also illustrated in Figure 5 with dashed lines. They show that only when the specification of the target and distracter voices was identical did the listeners make this type of error. As the SNR decreases from 15 dB the proportion of distracter confusions increased to a maximum at 0 dB SNR where there is no loudness cue to distinguish the target from the distracter. At negative SNR, the ratio of distracter errors decreased. These results show that the listeners were able to attend selectively to the target when the only difference between the target and distracter voices was loudness, even in adverse listening conditions where the distracter was louder than the target.
Effects of vocal characteristics
The fact that the psychometric functions all have a similar, cumulative gamma, shape independent of spoke angle, means that the best estimate of the main effect of RSD will be obtained by collapsing performance across spoke angle. The results are shown in Figure 6, where average performance is plotted as a function of the spoke-point numbers shown in Figure 1. Best performance occurs, as would be expected, for conditions where the distracter and target voices are maximally dissimilar. The effect of vocal characteristics is greatest for 0 dB SNR, where it is 29 %; for +6 dB and 6 dB SNR, the effect is 15 % and 22 %, respectively. Target-distracter confusions are shown by the dashed lines. This type of error occurs most often at 0 dB SNR (34%), and least often at +6 dB SNR (12%) when the voices are similar. This result is consistent with the finding that listeners derive a consistent advantage from a loudness difference. The sum of the target and distracter scores is presented in Figure 6, separately for each SNR, by dotted lines. These lines exhibit no effect of vocal characteristics; the only difference between them is their vertical position which illustrates the effect of SNR. This means that for a given SNR the listeners identified the syllables in a pair at a roughly constant level, but they were only successful at segregating the voices when there was a perceptible difference in vocal characteristics.

Modeling the effects of vocal characteristics
It was assumed, when generating the voices for the recognition experiment, that a difference in VTL needed to be about 1.5 times a difference in GPR in order to produce the same effect on recognition performance. An empirical model of the data was constructed to evaluate this assumption. The psychometric function (target recognition as a function of RSD along a spoke) appeared to be asymmetric, indicating that it would not be well fitted by a cumulative Gaussian. Moreover, RSD is limited to positive values, by definition, and the slope of the psychometric function should be 0 for an RSD of 0. As a result, the psychometric function was modeled with a cumulative gamma function rather than a cumulative Gaussian. In this case, the probability of target recognition as a function of RSD is:
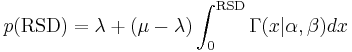
where Γ is the gamma function and α and β are its shape and scale parameters. The gamma function rises from 0 to 1 over its range, and so the function was offset and scaled on the p-axis by λ and μ, where λ is the intercept on the p-axis, and λ is the asymptotic recognition score for large RSD. The shape parameter, α, was restricted to be greater than 2 to ensure that the cumulative gamma function would have a gradient of zero at the p-axis intercept. The other parameters were limited only by their theoretical maximum range.
The psychometric function was fitted to the data using Maximum Likelihood Estimation (MLE); the trading value between VTL and GPR, χ, was a free parameter whose optimum value was estimated in the process. Briefly, MLE was used to fit a cumulative gamma function to all of the data simultaneously, and between iterations, the value of χ was varied (that is, the relative lengths of the GPR and VTL dimensions were varied) to find the value of χ that was most likely to have produced the observed data. The cost-function for this optimization was the log-likelihood obtained from the MLE stage. In one case, the procedure was applied separately to the three groups of eight psychometric functions associated with each SNR (+6, 0 and -6 dB); in a second case, the procedure was applied to the collective set of 24 psychometric functions from the three SNRs taken together. The psychometric functions for the collective fit are presented along with the data in Figure 7; the optimum trading value for this collective fit was 1.9. The optimum trading ratios for the three SNRs, fitted individually, were 1.9, 1.6, and 3.2 for SNR values of 6 dB, 0 dB, and -6 dB, respectively. It is the value from the collective fit (1.9) that was used to generate the surfaces in Figure 4. Since the trading value is different from the value of 1.5 used to generate the stimuli, the points from different spokes occur at different RSD1.9 values.

The surfaces are sets of elliptical, equal-performance contours fitted to the eight values from the eight spokes associated with each RSD value. The surfaces show the main effects of SNR, GPR and VTL on performance as discussed above. SNR is observed to have a large effect on performance when there are large differences between the vocal characteristics of the target and distracting speakers. Within a surface, there is a notable indentation in the centre where the vocal characteristics of the distracter approach those of the target voice, and the indentation is deepest for the 0-dB condition where the loudness cue is smallest. The range of performance values is greatest for the 0-dB condition, which suggests that the trading value for this surface, 1.6, might be the most reliable.
Discussion
The main experiment showed that listeners take advantage of VTL differences as well as GPR differences when trying to recognize competing syllables. The effect is most notable when the SNR is 0 dB and there is no loudness cue to assist in tracking the target speaker. In noisy, multi-speaker environments, normally hearing speakers raise the level of their voices, but they limit their vocal effort to achieve an SNR around 0 dB (Lombard, 1911). Hence, the 0-dB-SNR condition of the current experiment is relevant to everyday listening.
Trading relationship between VTL and GPR
In the current data, a 25 % increase in VTL yields the same performance advantage as a 2-ST increase in GPR. The optimal trading value obtained with a collective fit to all of the data was 1.9. Darwin et al (2003) reported data on the interaction of VTL and F0 in their study on concurrent speech. At 0-dB SNR, for a 38% difference in VTL, the performance advantage was 20%, and for a 4-ST difference in F0, the performance advantage was 20%<ref>Darwin et al. (2003) stated that 9 ST F0 difference corresponded to the advantage derived from a 38% VTL difference. However, in their Fig 1 it is apparent that a 4 ST yielded 20% performance advantage; 9 ST yielded approx. 25 %.</ref> . This corresponds to a trading relationship of 1.4, just below that observed at 0-dB SNR in the current experiment. They also found that when the VTL and GPR values both shifted towards larger speakers, there was more benefit that when they both shifted towards smaller speakers. Van Dinther and Patterson (2006) varied the musical equivalent of GPR and VTL in musical instrument sounds and measured the amount of change in the variables (pulse rate and resonance scale) required to discriminate the relative size of instruments from their sustained note sounds. The design allowed them to estimate the trading value between the variables which was found to be 1.3 with these sounds. This suggests that when listeners compare sounds with different combinations of pulse rate and resonance rate, pulse rate has a larger effect, in judgments of relative size, as might be expected from the fact that the JND for pulse rate is smaller than that for resonance scale.
Determinants of distraction
Our experiments show that the vocal characteristics of a competing speaker have a large effect on the amount of distraction caused by that speaker. This is most evident in Figure 5 which shows the psychometric functions for six different distracters. At 0-dB SNR, where no loudness cues are available, the noise masker reduced performance to 58%; but when the distracter was the identical voice, performance dropped further to 40%. This phenomenon (a drop in recognition performance without a change in SNR) is sometimes referred to as ‘informational masking’ (for a recent review, see Watson, 2005). The idea is that the degree of disturbance depends not only on the distracter’s ability to limit audibility (energetic masking), but also on its ability to pull attention away from an otherwise audible or partially audible target sound. In other words, informational masking is a quality separate from energetic masking which differentiates the effects of equally intense distracters. Note, however, that as the vocal characteristics of the distracting voice become more and more different from those of the target voice, the degree of informational masking decreases and actually becomes negative, in the sense that performance rises above that achieved when the target voice is presented in broadband, envelope-matched noise. This is true for all of the voices on the asymptotic part of the 0-dB surface in Figure 4 away from the indentation. The variation of the degree of informational masking is illustrated in Figure 5 by the conditions in which the SNR is 0 dB; performance rises from 40% when the target and distracter are the same voice, to 58% when the distracter is a noise masker, and on up to 70% when the distracter is one of the different voices. In short, the vocal characteristics of the distracter caused a drop in performance (relative to a noise masker of the same level) when the voices were similar and an increase in performance when the voices were dissimilar.
The difference between masking and distraction is also evident in the distribution of errors, and the interaction of error type with SNR. When the characteristics of the distracter caused a drop in recognition performance, it was often because the listener reported the distracter syllable rather than the target syllable (the dashed lines in Figure 6). If these ‘errors’ are scored as correct (because there was effectively no cue to tell the listener that they were attending to the wrong speaker), performance is observed to be largely independent of speaker characteristics for a given SNR. In other words, the main effect of reducing the RSD between the target and distracter is that listeners are increasingly unsuccessful at segregating the syllable streams of the competing voices. In a recent study on the release of informational masking based on spatial separation of the competing sources, Ihlefeld and Shinn-Cunningham (2008) also reported that most target-distracter confusions occurred for 0-dB SNR.
For conditions where the SNR was not zero, listeners appear to derive some value from loudness cues, even when the SNR is negative. The depth of the indentation in the performance surface (Figure 4) for data with an SNR of -6 dB, is less than it is for the performance surface for data with an SNR of 0 dB. A different view of this effect is provided in Figure 6; compare the solid lines with triangles (-6 dB) to those with circles (0 dB) as RSD decreases. The improvement in relative performance at negative values of SNR is similar to, although less pronounced than, the recovery phenomenon reported by Brungart (2001) at negative SNRs mentioned earlier. The data suggest that listeners can use loudness to reject the distracter and focus on the target even when it is softer than the distracter.
The depth of the indentation in the performance surface for data with an SNR of 0 dB emphasizes the importance of differences in vocal characteristics when there is no loudness cue. It is in this condition that listeners are observed to derive the most advantage from differences in VTL, GPR, or any combination of the two. A similar result involving spatial cues was reported by Ihlefeld and Shinn-Cunningham (2008). They showed that recognition performance was worse for an SNR of 0 dB than it was for an SNR of -10 dB, and that the largest relative advantage provided by spatial separation occurred when the SNR was 0 dB. In summary, the largest effects of spatial cues or vocal characteristics occur, not surprisingly, when there are no level cues.
Summary and conclusion
The experiments in this paper demonstrate how two speaker-specific properties of speech (glottal pulse rate, GPR, and vocal tract length, VTL) interact with each other and with signal-to-noise ratio (SNR) to determine performance in concurrent speech recognition. When there is a large difference between the speaker-specific characteristics of the target and distracter voices, performance is largely determined by SNR; as SNR decreases from +15 to -15 dB, performance drops from 88% to 34%. As speaker-specific differences between the target and distracter are reduced, performance decreases from the level imposed by the SNR by as much as 30%, and in these indentations in the performance surface (Figure 4), there is a tradeoff between the speaker-specific characteristics (GPR and VTL); when both variables are measured in log units, a change in VTL has to be about 1.9 times a change in GPR to have the same effect on performance.
Acknowledgements
The research was supported by the UK Medical Research Council [G0500221, G9900369] and the European Office of Aerospace Research & Development (EOARD) [FA8655-05-1-3043]. Any opinions, findings, and conclusions or recommendations expressed in this material are those of the authors and do not necessarily reflect the views of EOARD.
References
- Assmann, P. F., and Summerfield, Q. (1990). "Modeling the perception of concurrent vowels: Vowels with different fundamental frequencies," J. Acoust. Soc. Am. 88, 680-697.
- Assmann, P. F., and Summerfield, Q. (1994). "The contribution of waveform interactions to the perception of concurrent vowels," J. Acoust. Soc. Am. 95, 471-484.
- Bolia, R. S., Nelson, W. T., Ericson, M. A., and Simpson, B. D. (2000). "A speech corpus for multitalker communications research," J. Acoust. Soc. Am. 107, 1065-1066.
- Brungart, D. S. (2001). "Informational and energetic masking effects in the perception of two simultaneous talkers," J. Acoust. Soc. Am. 109, 1101-1109.
- Brungart, D. S., Simpson, B. D., Ericson, M. A., and Scott, K. R. (2001). "Informational and energetic masking effects in the perception of multiple simultaneous talkers," J. Acoust. Soc. Am. 110, 2527-2538.
- Chalikia, M. H., and Bregman, A. S. (1993). "The perceptual segregation of simultaneous vowels with harmonic, shifted, or random components," Percept. Psychophys. 53, 125-133.
- Collins, S. A. (2000). "Men's voices and women's choices," Anim. Behav. 60, 773-780.
- Cooke, M. (2006). "A glimpsing model of speech perception in noise," J. Acoust. Soc. Am. 119, 1562-1573.
- Culling, J. F., and Darwin, C. J. (1993). "The role of timbre in the segregation of simultaneous voices with intersecting f0 contours," Percept. Psychophys. 54, 303-309.
- Culling, J. F., and Summerfield, Q. (1995). "Perceptual separation of concurrent speech sounds: Absence of across-frequency grouping by common interaural delay," J. Acoust. Soc. Am. 98, 785-797.
- Darwin, C. J., Brungart, D. S., and Simpson, B. D. (2003). "Effects of fundamental frequency and vocal-tract length changes on attention to one of two simultaneous talkers," J. Acoust. Soc. Am. 114, 2913-2922.
- de Cheveigné, A. (1993). "Separation of concurrent harmonic sounds: Fundamental frequency estimation and a time-domain cancellation model of auditory processing," J. Acoust. Soc. Am. 93, 3271-3290.
- de Cheveigné, A. (1997). "Concurrent vowel identification. III. A neural model of harmonic interference cancellation," J. Acoust. Soc. Am. 101, 2857-2865.
- de Cheveigné, A., McAdams, S., and Marin, C. M. H. (1997a). "Concurrent vowel identification. II. Effects of phase, harmonicity and task," J. Acoust. Soc. Am. 101, 2848-2856.
- de Cheveigné, A., Kawahara, H., Tsuzaki, M., and Aikawa, K. (1997b). "Concurrent vowel identification. I. Effects of relative amplitude and f0 difference," J. Acoust. Soc. Am. 101, 2839-2847.
- Drennan, W. R., Gatehouse, S., and Lever, C. (2003). "Perceptual segregation of competing speech sounds: The role of spatial location," J. Acoust. Soc. Am. 114, 2178-2189.
- Elberling, C., Ludvigsen, C., and Lyregaard, P. E. (1989). "Dantale: A new danish speech material," Scand. Audiol. 18, 169-176.
- Fant, G. C. M. (1970). Acoustic theory of speech production (Mouton, The Hague).
- Fitch, W. T., and Giedd, J. (1999). "Morphology and development of the human vocal tract: A study using magnetic resonance imaging," J. Acoust. Soc. Am. 106, 1511-1122.
- Ihlefeld, A., and Shinn-Cunningham, B. G. (2008). "Spatial release from energetic and informational masking in a selective speech identification task," J. Acoust. Soc. Am. in press.
- Irino, T., and Patterson, R. D. (2002). "Segregating information about the size and shape of the vocal tract using a time-domain auditory model: The stabilised wavelet-mellin transform," Speech Comm. 36, 181-203.
- Ives, D. T., Smith, D. R., and Patterson, R. D. (2005). "Discrimination of speaker size from syllable phrases," J. Acoust. Soc. Am. 118, 3816-3822.
- Kawahara, H., and Irino, T. (2004). "Underlying principles of a high-quality speech manipulation system straight and its application to speech segregation," in Speech separation by humans and machines, edited by P. L. Divenyi (Kluwer Academic, Massachusetts).
- Lombard, E. (1911). " Le signe de l'élévation de la voix," Ann. Mal. Oreil. Larynx Nez Pharynx 37, 101-119.
- Marcus, S. M. (1981). "Acoustic determinants of perceptual center (p-center) location," Percept. Psychophys. 30, 247-256.
- Miller, G. A., and Licklider, J. C. R. (1950). "The intelligibility of interrupted speech," J. Acoust. Soc. Am. 22, 167-173.
- Moore, T. J. (1981). "Voice communications jamming research," in AGARD Conference Proceedings 311: Aural Communication in Aviation (AGARD, Neuilly-Sur-Seine, France), pp. 2:1-2:6.
- Peterson, G. E., and Barney, H. L. (1952). "Control methods used in a study of the vowels," J. Acoust. Soc. Am. 24, 175-184.
- Qin, M. K., and Oxenham, A. J. (2005). "Effects of envelope-vocoder processing on f0 discrimination and concurrent-vowel identification," Ear Hear. 26, 451-460.
- Ritsma, R. J., and Hoekstra, A. (1974). "Frequency selectivity and the tonal residue," in Facts and models in hearing, edited by E. Zwicker and E. Terhardt (Springer, Berlin).
- Rivenez, M., Darwin, C. J., and Guillaume, A. (2006). "Processing unattended speech," J. Acoust. Soc. Am. 119, 4027-4040.
- Rivenez, M., Darwin, C. J., Bourgeon, L., and Guillaume, A. (2007). "Unattended speech processing: Effect of vocal-tract length," J. Acoust. Soc. Am. 121, EL90-95.
- Smith, D. R., and Patterson, R. D. (2005). "The interaction of glottal-pulse rate and vocal-tract length in judgements of speaker size, sex and age," J. Acoust. Soc. Am. 118, 3177-3186.
- Summerfield, Q., and Assmann, P. F. (1991). "Perception of concurrent vowels: Effects of harmonic misalignment and pitch-period asynchrony," J. Acoust. Soc. Am. 89, 1364-1377.
- Titze, I. R. (1989). "Physiologic and acoustic differences between male and female voices," J. Acoust. Soc. Am. 85, 1699-1707.
- Turner, R. E., Walters, T. C., and Patterson, R. D. (2004). "Estimating vocal tract length from formant frequency data using a physical model and a latent variable factor analysis," in British Society of Audiology Short Papers Meeting on Experimental Studies of Hearing and Deafness (UCL London), pp. P61.
- van Dinther, R., and Patterson, R. D. (2006). "The perception of size in musical instruments," J. Acoust. Soc. Am. 120, 2158-2176.
- von Kriegstein, K., Warren, J. D., Ives, D. T., Patterson, R. D., and Griffiths, T. D. (2006). "Processing the acoustic effect of size in speech sounds," Neuroimage 32, 368-375.
- Watson, C. S. (2005). "Some comments on informational masking," Acta Acustica - Acustica 91, 502-512.