The Domain of Tonal Melodies: Physiological limits and some new possibilities
From CNBH Acoustic Scale Wiki
There is size information in musical sounds: There is the pitch of the note, which is correlated with instrument size, and there is the size of the resonators in the instrument, or the scale of the impulse response, which is also correlated with instrument size. If a violin and cello play the same note, it is still possible to tell which is the larger instrument. With regard to pitch, auditory neuroscientists have recently used brain imaging to show that the there are overlapping but distinguishable regions in the human brain for the processing of octaves and the cycle of notes within the octave. With regard to resonator size, they are using operator theory from quantum mechanics to understand the scaling of the impulse response, and to develop an auditory version of the Mellin Transform to explain how humans perceive size information in speech and music.
In this paper we argue that it is the auditory system that restricts the domain of notes that can be used to make melodies. We show that, within the domain, it is possible to change the size of an instrument and to change the octave of a note without going through the cycle of notes within the octave. The results have interesting implications for musicians; namely, that the notes currently used to make melodies with traditional instruments are just a small portion of the notes available to composers.
The text and figures that appear on this page were subsequently published in Dinther, R. van, and Patterson, R. D. (2005). "The domain of tonal melodies: Physiological limits and some new possibilities," Nova Acta Leopoldina NF Bd. 92, Nr. 341. Science and Music - The impact of music. 17-31.
Contents |
Introduction
Through the centuries, composers of orchestral music have been inspired to write melodies by musical instruments including the voice. At the same time, they have been restricted to the range of sounds these instruments can produce. Auditory perception research has broadened the understanding of how people perceive sounds, and it has provided new insights and ideas for extending the range of musical sounds. In general these new sounds cannot be produced by acoustical instruments. However, the development of electronic instruments and computers means that it is now possible to apply our knowledge of auditory perception to sound manipulation. Moreover, computers enable us to produce new classes of notes in a controlled manner with respect to auditory theory.
This paper will focus on two methods of extending the domain of musical notes in ways that might be musically productive: One focuses on the special rules that make it possible to blend instruments from the same family when they are playing notes whose pitches bear a simple integer ratio. This is the basis of the well known `Shepard' tone and we will show that it is just a special case of a more general `helix circle' sound which would appear to have considerable potential in composition. The second extension involves numerical methods for manipulating size information in musical sounds. It appears that we can provide the composer with synthetic, but highly realistic, instrument sounds where the composer has direct control over the size of the instrument just as they do over the pitch it produces. This means that the traditional pitch helix is more than just a wire. It is a complete surface and composers can write compositions where the melodies change simultaneously in pitch and instrument size, to execute ordered trajectories from circles to paisleys on the surface of the pitch helix.
Pitch is essential for tonal melodies since it is pitch that defines musical intervals. The first section of this paper describes constrains on notes that can be used to make tonal melodies and presents the domain of melodic pitch, including some recent experiments performed to determine the lower limit of pitch (Krumbholz et al., 2000) and the domain of melodic pitch (Pressnitzer et al., 2001) for multi-harmonic sounds. The second section describes ways of extending the domain of musical sounds and presents some applications.
The domain of melodic pitch
In orchestral music the range of notes available within the families of instruments all fall within the range of notes of the piano keyboard. The range is considerably less than the range of hearing and this raises the question why the range of notes of musical instruments are restricted to the keyboard range, and what the limits are on notes that can be used to convey melody. In this section we describe the domain of melodic pitch and how it is determined.
The ANSI definition of pitch says that {\em pitch is that auditory attribute of sound according to which sounds can be ordered on a scale from low to high}. For musicians, this definition is of little use; it is incomplete and vague. A number of scientists (e.g. Stevens et al. (1937) and !! Unknown ref stevens:1940 !!) have tried to tie pitch to the physical scale of acoustic frequency, but it only works for isolated sine tones (e.g. !! ERROR in <citet /> !!,Schouten et al. (1962) and Terhardt (1974)). The pitches of complex sounds, such as the vowels of speech and the notes of music, are more closely related to the repetition rate of the waveform, or the fundamental of the harmonics of the sound. This residue pitch has already been studied since the 19th century by !! Unknown ref seebeck:1841 !!.
This paper is about complex sounds, so pitch refers to the number of cycles per second (cps) of a waveform; within the period, the waveform can have any shape. The frequency of a sinusoidal tone is acoustic frequency in Hertz and it is this frequency that defines the limits of human hearing (20-20000 Hz). It is range of acoustic energy that humans are sensitive to. The range of human hearing is much larger than the range of pitch of most of the musical instruments, which does not extend below 27.5 cps or above 5000 cps. Auditory research has shown that above about 2 kHz, a sequence of tones does not convey melody reliably. Above this acoustic frequency the nerve impulses in the cochlea become progressively less well phase-locked to the stimulus. Krumbholz et al. (2000) investigated the lower limit of pitch for filtered, periodic click trains by measuring rate discrimination threshold (RDT). Krumbholz et al. (2000) found that the RDT of a periodic click train is about 30 cps when the harmonics are in cosine phase.
Figure 1 shows a Stabilised Auditory Image (SAI) (Patterson et al., 1995; Irino and Patterson, 2002) of a periodic, band-pass-filtered click train with a click every 8 ms (125 cps). The top panel shows the filtered click train in the time domain. The SAI is a simulation of the first internal representation of sound of which we are consciously aware. The ordinate is the tonotopic dimension produced by the basilar membrane in the cochlea; it is similar to a log-frequency axis. The abscissa is the time interval between neural impulses in the auditory nerve. The bottom panel shows the point-wise summation of the SAI across channels for each time interval; the right-hand panel shows the point-wise summation over time interval for each frequency channel.
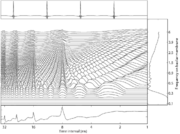
The SAI was computed with the auditory image model (AIM) (Patterson, 1994) and an implementation referred to as aim-mat (Bleeck et al., 2004). It is constructed in three stages. First, a spectral analysis is performed by a bank of gammatone filters Irino and Patterson (1997) which models the basilar membrane motion in the cochlea. The second stage simulates the neural transduction process performed by the inner hair cells; the result is a simulation of the neural activity pattern at the level of the cochlear nucleus. Periodic sounds with repetition rates above 32~cps are perceived as static or stationary, which indicates that the auditory system applies some kind of temporal integration to the neural activity patterns before we perceive them. Auditory research also indicates that the phase-locked fine structure observed in the neural activity patterns plays a role in the quality or timbre of a complex sound (Krumbholz et al., 2003). This is achieved in the third stage of AIM using `strobed' temporal integration (Patterson et al., 1992; Irino and Patterson, 1997). This process maps the repeating patterns produced by periodic sounds in the neural activity pattern onto one stabilised version of the pattern. The result is the SAI. In Figure 1 the vertical ridge at 8~ms shows that there is a concentration of time-intervals at 8 ms in many channels. This is the representation of pitch in AIM. The secondary vertical ridges arise because there are also concentrations of time intervals at multiples of 8 ms in the neural pattern. The bottom panel presents the summary SAI in which the period of the sound appears as an isolated maximum relative to the background level.
A click train with a click rate below 10~Hz does not produce a pitch; each click is heard as a separate event. For rates between 10 and 30 Hz, the dominant perception is one of flutter, and there are no ridges in the SAI or the summary SAI. It is only when the click rate rises above 30~Hz that the vertical ridge associated with pitch builds up in the SAI.
The click train in Figure 1 was band-pass filtered between 300 and 6000~Hz, and so there is no energy at the fundamental or the second harmonic. This does not change the pitch chroma although it does change the timbre slightly. If the high-pass cutoff is progressively increased, the strength, or salience, of pitch becomes weaker as the harmonics are removed, but the chroma remains the same. Ultimately, the pitch deteriorates what Plomp (1976)} refers to as rattle pitch, and in this case, the ridges in the SAI become broad and the peaks in the summary SAI fade into the background. The domain of melodic pitch is closely related to rate discrimination threshold (RDT). Krumbholz et al. (2000) measured RDT for periodic click trains that were filtered into bands with high-pass cutoffs ranging in frequency from 0.2 to 6.4~kHz. The results for a RDT of 3 % are presented in Figure 2, where it can be seen that RDT increases rapidly as the cutoff increases above 1 kHz. Pressnitzer et al. (2001)} investigated the lower limit of melodic pitch for band-pass filtered click trains. Threshold was defined as the lowest rate that would support detection of a semitone change in a short melody. They found that the lower limit was effectively the same as the 3 % RDT observed by Krumbholz et al. (2000).
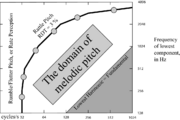
The region in the right-hand lower corner of the figure is shaded to indicate that notes cannot be produced in this region; the fundamental cannot be lower than the lowest harmonic. The region between RDT of 3 % and the shaded region is the domain of melodic pitch. Notes in this region can be used to make melodies where listeners would recognize if a note changed by a semitone. By and large, the notes of music and the vowels of speech all fall within this region.
There is more information in a complex tone than just its pitch. There is also information about octave height and the size of the instrument. These are the topics of the next two sections.
Octave height
For musicians, pitch has two dimensions in the sense that a note
has an octave (e.g.  ) and a position on the
cycle of notes within the octave
) and a position on the
cycle of notes within the octave
 . In
auditory perception, these dimensions are referred to as octave
height and pitch chroma and Warren et al. (2003) have shown that there
are overlapping but distinct regions of activation in the brain
for the processing of pitch chroma and octave height. The musical
scale of the keyboard can be represented as a helical curve with
one complete octave of notes per winding Figure 3. In
this representation, octave equivalence can be accommodated by
allowing notes on the surface of the cylinder that encompasses the
helix. On the cylinder, octave height is just the vertical
dimension of the helix; the circular dimension is pitch chroma.
. In
auditory perception, these dimensions are referred to as octave
height and pitch chroma and Warren et al. (2003) have shown that there
are overlapping but distinct regions of activation in the brain
for the processing of pitch chroma and octave height. The musical
scale of the keyboard can be represented as a helical curve with
one complete octave of notes per winding Figure 3. In
this representation, octave equivalence can be accommodated by
allowing notes on the surface of the cylinder that encompasses the
helix. On the cylinder, octave height is just the vertical
dimension of the helix; the circular dimension is pitch chroma.
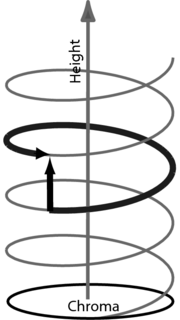
The structure of the helix prompted Shepard (1964) to create his `eternally ascending tone', in which the height of the note is gradually lowered an octave while it steps sequentially up through the 12 values of chroma in the octave. The sequence goes on forever without ever rising into the next octave. Shepard's `tone' was composed of harmonics spaced an octave apart, and it was filtered by Gaussian spectral filter (on a logarithmic frequency scale). As the top component is progressively attenuated and passes out of the top of the filter, another component comes in at a very low level at the bottom of the filter and, with care, the sound can be made to cycle over 12 notes. !! Unknown ref schroeder:1986} !! connected these self-similar waveforms with fractal objects.
Patterson (1990) suggested a method for varying octave height
in multi-harmonic sounds that covers a much broader range of
sounds than the Shepard tone, and which includes the sounds of
many musical instruments. The procedure involves attenuating the
odd harmonics of the sound as illustrated in
Figure 4. As the odd harmonics are attenuated the
octave height increases and when they are completely attenuated
the note is an octave higher. Most orchestral instruments have a
broad range of harmonics, and the odd harmonics can be attenuated
to raise the octave height. One interesting exception is the
clarinet; in the lower register the second harmonic is almost
complete absent, which give the clarinet its characteristic hollow
tone. The attenuation procedure can be made more general to handle
incomplete harmonic sequences as follows: Define an
N-dimensional frequency space F where N is the frequency
range. Each dimension represents the amplitude of one component on
the frequency-axis for the frequencies 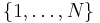 . The
amplitude spectra of the signal and its octave are represented by
two vectors, say
. The
amplitude spectra of the signal and its octave are represented by
two vectors, say  and
and  , respectively, in this frequency space
F. The octave height can then be varied by simply following the
linear path between the two vectors in the frequency space
, respectively, in this frequency space
F. The octave height can then be varied by simply following the
linear path between the two vectors in the frequency space  ;
;
 for
for ![\lambda \in [0,1]](../images/math/a/d/a/ada29722c713d4d8a571d9a4ce353ae6.png) .
In the right panel in Figure 4 stages are shown for
changing the octave height in the case where some harmonics are
absent.
.
In the right panel in Figure 4 stages are shown for
changing the octave height in the case where some harmonics are
absent.
The procedure amounts to defining the note for the two octave boundaries and then mixing the two octaves in varying proportions to produce intervening notes with the same chroma and very similar timbre. The possibility of changing octave height without changing the chroma provides the composer with a set of notes that fills in the space between the notes provided on traditional instruments. In the next section, we review the size information in musical instruments and show how it is possible to provide the composer with control of the perception of instrument size.
Size information in musical sounds
The size information in a musical note is related to the pitch of the notes and the scale of the impulse response of the instrument. Music theory tends to emphasize the pitch component of size information and overlook the scale of the impulse response. The impulse response of an instrument reveals the natural, resonant frequencies of vibration which decrease as the size of the instrument increases. A musical instrument vibrates readily at its resonant frequencies, and resists vibration at other frequencies. Similarly, a vibrating object will pick out its resonant frequencies from a complex excitation and resonate at those frequencies `filtering out' other frequencies in the excitation wave. Most vibrating objects have multiple resonant frequencies, for example, the primary resonances of string instruments are the main wood and air resonance (Benade, 1976). These resonances are important indicators of the quality of the instrument. For a 1713 Stradivarius the air resonance and main wood resonance lie near the frequency of the D string and a little bit below the frequency of the A string, respectively (!! Unknown ref hutchins:1962 !!).
As the size of the body of a musical instrument increases, the frequencies of the resonances decrease in inverse proportion as illustrated in Figure 5. The top and bottom panels show the power spectra of notes produced by bowing a viola and a cello, respectively. The instruments are playing the same note (pitch). The hypothetical solid lines plotted above the harmonics in the panels represent resonance curves for the two instruments. The air resonance (A), main wood resonance (W), and bridge resonance (B) are indicated in the figure. For the viola the air, main wood and bridge resonances are about 230 Hz, 350 Hz and 2000 Hz, whereas the resonances of the cello are about 125 Hz, 175 Hz and 1500 Hz.
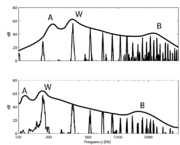
Since the two instruments play the same note, the figure helps us understand how we perceive the body size information in string sounds; we perceive the shift of the center of gravity of the spectrum as instrument size. Most musical instruments generate sounds with distinctive spectral envelopes, and so in most cases, the location of the resonances can be used to judge instrument size. For woodwinds, important parameters which have an effect on the shape of the spectral envelope are the shape and size of the mouthpiece, and the tone-hole cutoff frequency. For brass instruments, it is mainly the mouthpiece and the bell that determine the characteristic sound of brass (Benade, 1976).
We have to be careful about the definition of the size of an instrument because some instruments change in size during playing, for example brass instruments. Both the pitch and the scale of the impulse response change during playing, which suggests, that it would be difficult to judge the size of these instruments. However, a change in size within an instrument does not always result in a shift of the spectral envelope. In the case of the trombone changes in body length contribute to the pitch of the note, and the spectral envelope is mainly determined by the mouthpiece and bell. Figure 6 shows a stylized picture of a trombone.
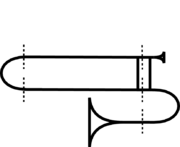
The total length L that the air passes through is the sum of the
length of the mouthpiece, the tubes and the bell:  . The length of
  for
is variable due to the slider, and the total
length of the tube can be extended to a maximum of
for
is variable due to the slider, and the total
length of the tube can be extended to a maximum of  . The
cylindrical part of the trombone is a closed air column and
produces resonant standing waves at the fundamental frequency and
its odd harmonics. The length of the tube determines the spacing
between the resonant frequencies. A longer tube length will lower
the resonant frequencies and will decrease the spacing between
them in the spectrum.
. The
cylindrical part of the trombone is a closed air column and
produces resonant standing waves at the fundamental frequency and
its odd harmonics. The length of the tube determines the spacing
between the resonant frequencies. A longer tube length will lower
the resonant frequencies and will decrease the spacing between
them in the spectrum.
The effect of the bell raises the lower resonances from those of a closed tube toward a harmonic sequence. This effect is related to the location of the barrier at the bell from where the sound waves are reflected. For low-frequency sounds the barrier is near the end of the bell where it meets the cylindrical tube; for higher frequencies the barrier is shifted towards the mouth of the bell. Above a certain frequency, depending on the flaring of the bell, the sounds penetrate the barrier and are not reflected, and thus the resonances at those frequencies are absent.
The mouthpiece tends to force the high resonances into a harmonic sequence with respect to the resonances of a closed tube. The mouthpiece acts like a Helmholtz resonator, its natural resonant frequency depends on the volume of the cup and the constriction diameter. The mouthpiece is an important parameter for the shape of the resonance curve. The resonances of the tube that lie near the natural resonance of the mouthpiece are emphasized and can increase the impedance in that neighborhood by about five times. The larger the cup volume and the diameter of the mouthpiece, the lower its natural resonant frequency. As a consequence, the spectral shape is shifted in the frequency domain and the sound produced by the instrument is perceived to be larger.
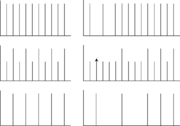
Methods for measuring the resonances of brass instruments were reported by Benade (1976) and !! Unknown ref backus:1977 !!. Backus measured the resonance data for the mouthpiece by exciting the air column by a loudspeaker through a capillary tube near the mouthpiece end and measuring the pressure in response to the excitation by a response microphone which was attached at the mouthpiece. Figure~\ref{resonancesbrass} shows the resonances of a brass instrument. In the top panel the resonances are shown for the tube alone. The bottom panel shows the resonances of a complete brass instrument. The dashed vertical lines represent the resonances of the tube (top panel) and the complete instrument (bottom panel). The dotted vertical lines show the resonances when the tube length is extended. The solid vertical lines in the bottom panel show overlapping resonances of the two different tube lengths. The arrows in the figure show the spacing between the resonances.
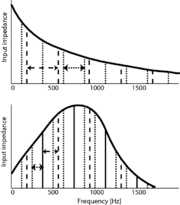
We observe from the top panel of Figure 7 that an extension of the tube length results in a shorter spacing between the resonances. In the bottom panel we observe that an extension of the tube length affects the spacing between the resonances, but does not shift the resonance curve.
In summary, the shape and size of the mouthpiece and the bell are important factors in determining the shape of the spectral envelope and its location on the frequency axis, whereas the length of the tube contributes mainly to the pitch of the note (the repetition rate of the wave). Playing different notes on a brass instrument will not cause a shift of the spectral envelope of the sound, and thus listeners can use this cue to judge its size. Similar arguments apply for woodwind instruments, such as the saxophone and clarinet.
In the next section, we describe a) experiments on the perception of size information in vowel sounds scaled by the vocoder, and b) a new high-fidelity vocoder and how it can be adapted for use as a mucoder (music coder).
Size perception and the mucoder STRAIGHT
Smith and Patterson (2005) have shown that listeners are able to discriminate between vowels sounds produced with the same pitch but different vocal tract lengths. Moreover, they have shown that listeners are even able to do this task for vocal tract lengths well beyond normal experience. They argue that the auditory system performs some kind of active normalisation to all input sounds Irino and Patterson (2002), and that it is not necessary to learn statistical relations between pitch and resonant frequency in natural sounds as suggested by Assmann et al. (2002).
The stimuli for these experiments were produced by a vocoder referred to as STRAIGHT which is actually a sophisticated speech processing package that dissects and analyzes an utterance at the level of individual glottal cycles Kawahara et al. (1999). It segregates the pitch and vocal tract length information and stores them separately, so that the utterance can be resynthesized later with arbitrary shifts in pitch and vocal tract length. Utterances recorded from a man can be transformed to sound like women and children. The advantage of STRAIGHT is that the spectral envelope of the speech that carries the vocal tract information is transformed, as it is extracted, to remove the harmonic structure associated with the original glottal pulse rate (pitch), and the harmonic structure associated with the frame rate of the analysis window. As a result, the resynthesized utterances are of extremely high quality even when the speech is resynthesized with pitches and vocal tract lengths well beyond the normal range of human speech. The vocoder STRAIGHT also proves to be a fairly good mucoder; that is, a device for encoding, manipulating and resynthesising music. Informal experiments indicate that manipulating musical notes with STRAIGHT to vary the pitch and instrument size works quite well for some instruments (e.g., brass) but not so well for others (clarinet). The success or failure seems to depend largely on the degree to which the wave used to re-excite the spectral envelope matches that which normally excites the instrument. STRAIGHT simulates the stream of glottal pulses in a vowel by summing a series of harmonics of the voice pitch. Initially, the harmonics are in cosine phase and the wave is like a band-pass filtered click train. Then, to make the speech sound more natural, a sophisticated form of jitter is applied to the phase of the high-frequency harmonics. The excitation of brass instruments is pulsive with much less phase jitter than in speech, and so STRAIGHT can be modified to mucode brass notes with considerable success, by simply turning off the phase jitter module. To adapt STRAIGHT for other instruments is somewhat more complicated, but the principal is the same and for some instruments, at least, the technique appears straightforward. For example, the excitation of the clarinet is like the sum of a series of odd harmonics of the pitch, since the clarinet is a classical tube closed at one end. With STRAIGHT we are able to change the pitch, the body size and the octave height of musical instrument sounds almost independently. In the next section we will present some musical applications of these concepts.
Some applications using body size and octave height for creating new notes
In this section we demonstrate how to change the octave height and body size of instrument sounds. For convenience, we describe the manipulations applied to a recorded instrument in terms of the resulting change in body size; namely grow - stay - shrink. The first manipulation `grow' refers to an increase in body size; the second, `stay', refers to no change in body size; the third, `shrink' refers to an decrease in body size. Figure 8 shows a spectrogram of a cello where the `grow-stay-shrink' transform has been applied. The x-axis is time, the y-axis is frequency and the gray level shows the energy. The darker bands show the resonances.
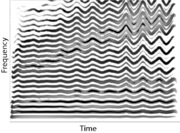
During the first manipulation (A), the resonances of the cello are shifted down in time and we perceive the instrument growing. In the last part (C), the resonances return upwards over time and the instrument is perceived to shrink.
The shrink manipulation can be combined with the octave height manipulation to produce a sound in which a tenor is gradually `morphed' into a boy. The octave height is increased an octave over the course of the sound. Figure 9 shows a spectral view of this example in which the odd harmonics can be observed to decrease in magnitude of time.
Attenuation of 24~dB on the odd harmonics is sufficient to give the perception of the higher octave. At the same time, the formants are shifting upwards which imparts the perception of a person shrinking.
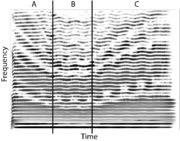
The final example is an `auditory zoom' zoom in - zoom out of the sort that would be appropriate to accompany an object appearing in a scene as a spec, then zooming in to its appropriate size and finally zooming out to a spec again. The spectrum of the instrument is compressed to a single frequency at the start. The frequency dimension is expanded as the note proceeds to its full size. Then at the end, it is progressively compressed again and the sound disappears back into a spectral point. In Figure 10, the manipulations `zoom in' and `zoom out' are applied to the singing voice.
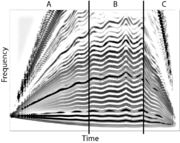
The figure shows (A) how the harmonics appear from one frequency and gradually are transformed to form a full spectrum of harmonics in part (B), at which point the voice sounds natural. In part (C) the harmonics are reduced again to a single frequency. One could, of course, have the instruments of an orchestral family zoom in from spectral points appropriate to the centroid of their average spectrum. The options would appear to endless, constrained only by the creativity of the scientist and the composer.
References
- Assmann, P.F., Nearey, T.M. and Scott, J.M. (2002). “Modeling the perception of frequency-shifted vowels”, in ICSLP-2002, p.425-428. [1]
- Benade, A.H. (1976). Fundamentals of Musical Acoustics. (Oxford University Press). [1] [2] [3]
- Bleeck, S., Ives, T. and Patterson, R.D. (2004). “Aim-mat: The Auditory Image Model in MATLAB.” Acta Acustica, 90, p.781-787. [1]
- Irino, T. and Patterson, R.D. (1997). “A time-domain, level-dependent auditory filter: The gammachirp.” J. Acoust. Soc. Am., 101, p.412-419. [1] [2]
- Irino, T. and Patterson, R.D. (2002). “Segregating Information about the Size and Shape of the Vocal Tract using a Time-Domain Auditory Model: The Stabilised Wavelet-Mellin Transform.” Speech Commun., 36, p.181-203. [1] [2]
- Kawahara, H., Masuda-Katsuse, I. and de Cheveigné, A. (1999). “Restructuring speech representations using a pitch-adaptive time-frequency smoothing and an instantaneous-frequency-based F0 extraction: Possible role of a repetitive structure in sounds.” Speech Comm., 27, p.187-207. [1]
- Krumbholz, K., Patterson, R.D., Nobbe, A. and Fastl, H. (2003). “Microsecond temporal resolution in monaural hearing without spectral cues?.” J. Acoust. Soc. Am., 113, p.2790-2800. [1]
- Krumbholz, K., Patterson, R.D. and Pressnitzer, D. (2000). “The lower limit of pitch as determined by rate discrimination.” J. Acoust. Soc. Am., 108, p.1170-1180. [1] [2] [3] [4] [5]
- Patterson, R.D. (1990). “Auditory warning sounds in the work environment.” Philos. Trans. R. Soc. Lond., B, Biol. Sci., 327, p.485-92. [1]
- Patterson, R.D. (1994). “The sound of a sinusoid: Spectral models.” J. Acoust. Soc. Am., 96, p.1409-1418. [1]
- Patterson, R.D., Allerhand, M.H. and Giguère, C. (1995). “Time-domain modeling of peripheral auditory processing: A modular architecture and a software platform.” J. Acoust. Soc. Am., 98, p.1890-1894. [1]
- Patterson, R.D., Robinson, K., Holdsworth, J., McKeown, D., Zhang, C. and Allerhand, M. (1992). “Complex Sounds and Auditory Images”, in Auditory Physiology and Perception, Y Cazals L. Demany and Horner, K. editors (Pergamon Press, Oxford). [1]
- Plomp, R. (1976). Aspects of Tone Sensation. (Academic). [1]
- Pressnitzer, D., Patterson, R.D. and Krumbholtz, K. (2001). “The lower limit of melodic pitch.” J. Acoust. Soc. Am., 109, p.2074-2084. [1] [2]
- Schouten, J.F., Ritsma, R.J. and Cardozo, B.L. (1962). “Pitch of the residue.” J. Acoust. Soc. Am., 34, p.1418-1424. [1]
- Shepard, R.N. (1964). “Circularity in judgements of relative pitch.” J. Acoust. Soc. Am., 36, p.2346-2353. [1]
- Smith, D.R.R. and Patterson, R.D. (2005). “The interaction of glottal-pulse rate and vocal-tract length in judgements of speaker size, sex, and age.” J. Acoust. Soc. Am., 118, p.3177-3186. [1]
- Stevens, S., Volkmann, J. and Newman, E. (1937). “A scale for the measurement of the psychological magnitude pitch.” J. Acoust. Soc. Am., 8, p.185-. [1]
- Terhardt, E. (1974). “On the perception of periodic sound fluctuations (roughness).” Acustica, 30, p.201-213. [1]
- Warren, J.D., Uppenkamp, S., Patterson, R.D. and Griffiths, T.D. (2003). “Analyzing pitch chroma and pitch height in the human brain.” Ann. N. Y. Acad. Sci., 999, p.212-4. [1]