File:Fig6 SPjasa05.PNG
From CNBH Acoustic Scale Wiki
No higher resolution available.
Fig6_SPjasa05.PNG (611 × 497 pixels, file size: 20 KB, MIME type: image/png)
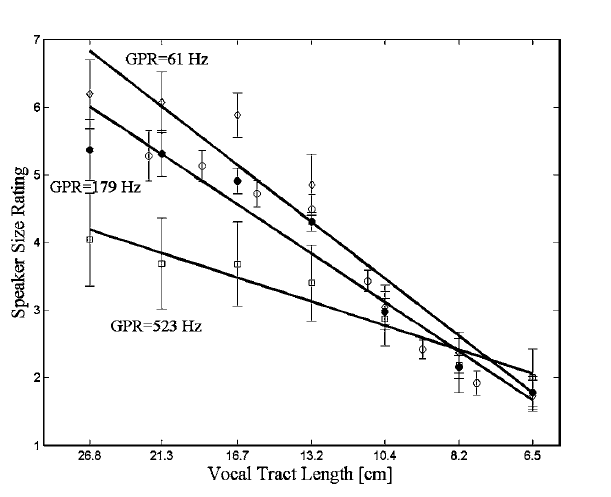
Figure 6. Perceived speaker size as a function of VTL, for GPRs of 61, 179, and 523 Hz. The solid lines show the best-fitting regression lines for speaker size rating as a function of the natural logarithm of VTL. For all other details see Fig. 5.
File history
Click on a date/time to view the file as it appeared at that time.
| Date/Time | Thumbnail | Dimensions | User | Comment | |
|---|---|---|---|---|---|
| current | 15:53, 15 August 2008 | | 611×497 (20 KB) | AlessandroB (Talk | contribs) |
- Edit this file using an external application (See the setup instructions for more information)
File links
The following page links to this file: