Comparison of relative and absolute judgements of speaker size
From CNBH Acoustic Scale Wiki
A version of this paper was presented at the Salt Lake City meeting of the ASA. The reference above is to the version that appears in POMA, the online journal of Proceedings Of Meetings on Acoustics hosted by the ASA.
Tom Walters , Roy Patterson
Contents |
Introduction
Humans can make accurate discriminations about the relative size of speakers based on speech sounds (Smith et al., 2005; Ives et al., 2005). These judgements are strongly affected by two variables: glottal pulse rate (GPR) and vocal tract length (VTL). GPR is largely determined by the mass and tension of the vocal folds. VTL is the distance from the vocal folds to the lips, and it is strongly correlated with speaker height (Fitch and Giedd, 1999). Thus, a speaker with a low GPR and a long vocal tract (as is typical for a man) is perceived as larger than a speaker with a high GPR and a short vocal tract (as is typical for a child).
Recently, research in this area has focused on the interaction of GPR and VTL and their relative contribution to the perception of speaker size. This paper presents a new method for assessing the relative contribution of GPR and VTL to the perception of relative size.
Scaling the GPR and VTL of recorded vocalisations
There is a software vocoder, STRAIGHT, (Kawahara and Irino, 2004; Kawahara et al., 1999) which makes it possible to modify the GPR and VTL of recorded vocalisations while preserving the linguistic content and other speaker characteristics. STRAIGHT segregates the information concerning GPR and VTL from the other information. GPR and VTL can then be separately manipulated before they are recombined to synthesize new speakers with varying apparent sizes. Thus it is possible to take an utterance from a single speaker, and scale the carrier of the vowel to any point in the GPR-VTL plane (e.g., Smith et al., 2005; Smith and Patterson, 2005; Ives et al., 2005; von Kriegstein et al., 2006).
Estimation of absolute speaker size
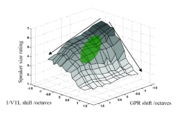
Smith and Patterson (2005) demonstrated that there is a trade-off between GPR and VTL when making absolute judgements of speaker size. They used STRAIGHT to scale recorded vowels in VTL and GPR. Listeners rated stimuli with different GPR and VTL combinations on a seven-point scale from very small to very large. The range of GPR and VTL values included the combinations encountered in everyday life and some combinations considerably beyond the normal range. In Figure 1, the results of Smith and Patterson are presented as a surface above the GPR-VTL plane. The axes have been converted to log2 following the convention recommended in van Dinther and Patterson (2006), a unit step therefore corresponds to a doubling or halving of GPR or VTL. The green ellipse shows the approximate region occupied by the speakers that one would expect to encounter in everyday life. This region was found from a re-analysis of the classic vowel data of Peterson and Barney (1952) by Turner et al. (2004).
The size surface of Smith and Patterson shows a nonlinear relationship between VTL and perceived size; the surface is relatively shallow in the VTL direction in the region where the voices are perceived to be people of normal size; then, the slope becomes steeper as the perceived size decreases beyond the normal range. This suggests that listeners are most sensitive to VTL changes within the normal range of experience. The dependence of perceived size on GPR is smaller than that for VTL, and it is more linear. These results suggest that VTL plays a larger role in the perception of speaker size than does GPR.
Measuring the slope of the VTL-GPR surface
There is an alternative method for determining the size perception surface, which is to measure the slope of the surface at a number of points, and then integrate the slope values across the GPR-VTL plane. The attraction of this method is that size discrimination judgements obtained with a two-alternative forced-choice (2AFC) procedure can be used to define the slope, and discrimination values obtained in this way are particularly stable. The listener’s task is to compare two intervals containing vowel phrases spoken by two slightly different speakers (different in GPR and VTL), and decide which interval contained the smaller speaker. If the combinations of GPR and VTL are chosen carefully, the discrimination data reveal the local gradient of the size surface over the GPR-VTL plane simultaneously in both dimensions. The slope at intervening points can be interpolated, and the two-dimensional grid of slope vectors can be integrated to provide an estimate of the size surface.
Methods
Stimulus generation
Five sustained canonical vowels (/a/, /e/, /i/, /o/, /u/) spoken by a woman were recorded using a Shure SM58-LCE microphone in an IAC sound-attenuating booth. A SoundBlaster Audigy II PC sound card was used to make the recording, with a 48 kHz sampling rate and 16-bit quantization. The vowels were sustained such that the duration of the stable central part was 800ms. A cosine-squared amplitude function was used to gate this section on over 30ms and off over 90ms. RMS levels for the sounds were adjusted to the same value. These sounds were then scaled with STRAIGHT to different values of GPR and VTL. An adult woman was chosen as the starting point for the synthesis because GPR and VTL values for adult females are positioned centrally in the normal range of human voices, which minimizes the overall scale changes required to synthesise the extremal sounds.
Stimulus configuration
Sample points
In order to measure the local gradient at a point in the GPR-VTL plane, the listener was required to compare a speaker with that VTL and GPR to speakers with similar combinations of GPR and VTL in a small region about the target voice. This gradient was measured at 16 points, distributed evenly in a 4 x 4 matrix, across the log-VTL, log-GPR plane.
Measurement of local gradient
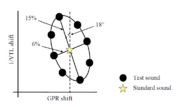
To make measurements of local gradient in a 2AFC paradigm, it was necessary to present stimuli that differed enough to be discriminable, but not so much that they lay far from one another in the GPR-VTL plane. Since the JNDs for VTL and GPR have been shown to be different (Smith et al., 2005 and Ives et al., 2005), an ellipse configuration in the log(GPR)-log(VTL) plane was chosen for the stimuli around each sample point. This allowed the larger JND for VTL to be taken into account so that the stimuli could be balanced such that the perceptual distance for each comparison was roughly the same. Eight points were used on each ellipse. In order to avoid presenting the subjects with pairs of stimuli to compare in which only one variable was changing, the ellipse of sample points was rotated by 18° to offset the major and minor axes slightly from the axes of the VTL-GPR plane. Figure 2 shows the configuration of the ellipses used in the experiment. Comparisons were made between the central stimulus and those on the locus of the ellipse. Based on these comparisons, a ‘weight’ for each point was found based on the number of times it was picked by a subject as being from a smaller speaker than the central test stimulus. Three sizes of ellipse were used during the experiment: a large training ellipse, and medium and small sized experimental ellipses. The data for the two experimental ellipses are presented in the final analysis. The major and minor axes of the medium sized ellipse corresponded to a 6% change in GPR and a 15% change in VTL.
Experimental Procedure
Stimuli were trains of four vowels chosen randomly without replacement from the five recorded vowels. Seven subjects with normal hearing, two female and five male, participated in the experiment. One of the subjects had significant experience in making size discrimination judgements in experimental conditions while the other six were naïve listeners. All the subjects were given training before collection of the experimental data. In the experiments the subjects were asked to make a choice between two trains of vowels, deciding which came from the smaller speaker. No feedback was given in either the training or the experimental sessions, as the judgements were entirely subjective. Stimuli were presented at a bit depth of 16 bits and a sample rate of 48 kHz. The stimuli were played back by a PC sound card (Creative Labs SoundBlaster Audigy 2) through a TDT anti-aliasing filter with a sharp cut-off at 10 kHz and a final attenuator. The stimuli were presented binaurally to the listener over AKG K240DF headphones at a comfortable listening level. Listeners were seated in a double-walled IAC sound-attenuating booth. A run consisted of a complete, randomised, set of comparisons of all points around the 16 ellipses with the corresponding centre point, thus a total of 128 comparisons were made per run. Two runs on the large training ellipses were used to familiarise the subjects with the experiment. In the full experiment six runs were carried out on six of the listeners on the medium ellipses and a further five runs on the smaller ellipses. Three of these listeners participated in a further run on the small ellipses. A full data set was not recorded from the seventh subject due to time constraints. This subject completed only four runs on the medium ellipses; these are included in the final analysis.
Determining gradients and fitting a surface
Inference techniques were employed to find the local gradient of the surface and the variability of the gradient, by modelling the perception of size as a random variable with a two-dimensional Gaussian distribution about the size of the target speaker. The final stage of the analysis fitted a surface to the inferred gradients. The surface was described using a two-dimensional polynomial. The order of the polynomial was chosen to ensure enough degrees of freedom to describe the data well, but not so many as to allow over-fitting. The proportion of fitted gradients lying within 1σ of the experimentally-determined gradients was used to judge the quality of fit, allowing identification of both over-fitting and under-fitting. Once a surface had been fitted, two free parameters not defined by the fitting procedure remained to be chosen. These were an offset and a scaling factor. The free parameters result from the integration of the differential surface interpolated from the gradient vectors. In order to set the parameters, two points on the plane where a value of size is known are required. GPR and VTL values extracted from the data of Peterson and Barney (Turner et al. 2004) were used for this purpose. They show the position of an average man, woman and child in the space. It was found that fitting the surface using the extremal groups – men and children – produced the best results. The same technique was also used on the data from Smith and Patterson (2005), allowing the two surfaces to be compared.
Results
Gradient vectors
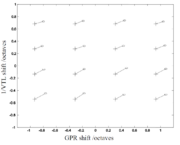
The results of inferring the gradient of the surface from the two different sizes of ellipse, using the data from all subjects, are shown in Figure 3. Log2 of GPR is the abscissa and log2 of SER is the ordinate, normalised such that the standard female is at zero. Each of the sixteen points at which the gradient is to be sampled is ringed by a further sixteen stimulus points, arranged about the loci of two ellipses with the same major-minor axis ratio. The vector emerging from each sample point shows the inferred instantaneous gradient from the smaller and larger ellipses combined. In each case the vector is oriented in the direction of steepest descent of the surface and its length denotes the magnitude of that descent as compared to the other ellipses. The ellipse at the end of each gradient vector shows the 1σ error in the position of the end of the gradient vector. The gradient vector orientations inferred from all the sample ellipses are very consistent, suggesting that the size surface is planar to a good first approximation.
The Fitted Surface
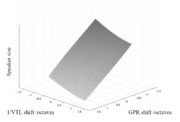
Figure 4 shows the final size surface fitted to the set of gradients inferred from both ellipse sizes across all subjects. The main feature of this surface is that it is very close to being planar. The relative contribution of VTL and GPR to size discrimination judgements can be largely understood directly from the two surface gradients. The coefficients are -9.6 in the GPR direction and -4.5 in the VTL direction, suggesting that GPR has about twice the salience of VTL as a size cue across the plane. The largely planar nature of the inferred size surface shows that size perception is linear in logarithmic space. This means that, at any point on the plane, a given percentage change in GPR and a given percentage change in VTL have the same effect on the perceived change in size. The perception of size is essentially uniform, even outside the normal range of human experience. The planar surface observed in this study is similar to the essentially planar relationship observed in a study of the perception of the size of musical instrument sounds by van Dinther and Patterson (2006). In this case, the trading relationship between the more general features of pulse rate (equivalent to GPR) and resonance scale (equivalent to VTL), was found to be around 1.3; in the current study the trading relationship is 2.2.
Comparison with Smith and Patterson (2005)
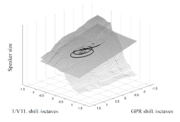
Figure 5 shows the surface obtained from the current experiment, plotted on the same axes as the surface of Smith and Patterson (2005). Both surfaces are scaled and shifted such that the data points closest to those corresponding to the average man and child in each case are at the same position. The ellipses of Turner et al. (2004) are overlaid to show the domain of normal speakers. Within this range, the slopes of the two surfaces are comparable; outside, the range of normal experience, as the VTL of the speaker decreases, the surface for direct estimates from Smith and Patterson (2005) drops rapidly down from the surface obtained with slope estimates. The difference between the two surfaces can be explained in terms of the difference between absolute and relative perception of size. In Smith and Patterson's (2005) study, the judgements were of absolute size, and at the same time the subjects were asked whether the voice was that of a man, woman, boy or girl. It is clear that the subjects were thinking of the stimuli as real human voices, and therefore these judgements would be affected by their experience of the voices encountered in normal life. In the current study, at no point are the subjects required to make an absolute judgement of size, and so there is little opportunity for any experience of the normal range of human voices to affect their judgements. Based on these two sets of data, it seems likely that there is a nonlinearity between the perceptual mapping of the variable ‘size’ as a relative percept and the variable ‘size’ as a categorisation variable. In making absolute judgements of size, the listener will relate the size of the speaker heard to their everyday experience; thus those exceptional sounds, well outside the normal range of human experience, will be more likely to be categorised as 'very large' or ‘very small’. Is has been argued that the auditory system performs a normalisation for speaker size via a series of transforms on an incoming signal (Irino and Patterson, 2002). The planar surface obtained in this study could be seen as the 'size' output from these transforms, whereas the size surface of Smith and Patterson (2005) shows the additional effect of a subsequent perceptual 'warping' of the surface based on learned statistics about the expected range of speaker sizes.
Summary and Conclusions
Listeners were presented with vowels in a two-alternative forced-choice paradigm. The listener heard two trains of four vowels, scaled in GPR and VTL, and had to make a judgement about which sound came from the smaller speaker. The differential measurements made by the listeners were processed to find the instantaneous gradient of the perceived size at 16 points in the GPR-VTL plane. These gradient measures were then interpolated and integrated to retrieve a measure of relative perceived speaker size as a function of GPR and VTL. The perception of size was found to be, to first approximation, linear in both GPR and VTL. The effect of GPR was found to be about twice that of VTL on the perception of speaker size for the same percentage change. The results found here correspond well to those of van Dinther and Patterson (2006), who showed an essentially planar relationship between resonance rate (VTL equivalent) and pulse rate in the sounds of musical instruments. In that case, the pulse rate is again found to be more important, although there is a smaller difference in the relative contribution of the variables. A comparison was made between the surface recovered in this study and that of Smith and Patterson (2005) from an experiment in which listeners made absolute judgements of speaker size. There are significant differences between the two surfaces, which can be explained as the difference between making absolute and relative judgements of speaker size. It is suggested that making an absolute judgement of speaker size requires a further, learned, mapping from a lower level percept of acoustic scale, which is a natural product of the pre-processing performed by the auditory system. The surface produced in this study corresponds more closely to the acoustic scale of a sound whereas the surface produced by Smith and Patterson (2005) corresponds to the learned mapping from acoustic scale to expected speaker size.
Acknowledgements
This research was supported by the UK Medical Research Council (G9901257, G9900369). This work has previously been reported in abstract form (Gomersall et al., 2004).
References
Fitch, W. T. and Giedd, J. (1999). “Morphology and development of the human vocal tract: A study using magnetic resonance imaging,” J. Acoust. Soc. Am. 106, 1511-1522.
Gomersall, P. A., Walters, T. C., Turner, R. E. and Patterson, R. D. (2004). “The relative contribution of glottal pulse rate and vocal tract length in size discrimination judgements,” Poster P59, British Society of Audiology short papers meeting, London, UK
Irino, T. and Patterson, R. D. (2002). “Segregating Information about the Size and Shape of the Vocal Tract using a Time-Domain Auditory Model: The Stabilised Wavelet-Mellin Transform,” Speech Communication 36, 181-203.
Ives, D. T., Smith, D. R. R. and Patterson, R. D. (2005). “Discrimination of speaker size from syllable phrases,” J. Acoust. Soc. Am. 118, 3186-3822.
Kawahara, H., Masuda-Katsuse, I. and de Cheveigné, A. (1999). “Restructuring speech representations using a pitch-adaptive time-frequency smoothing and an instantaneous-frequency-based F0 extraction,” Speech Communication 27, 187-207.
Kawahara, H. and Irino, T. (2004). “Underlying principles of a high-quality speech manipulation system STRAIGHT and its application to speech segregation,” in Speech Segregation by Humans and Machines, edited by P. Divenyi, Kluwer Academic, Boston, 167–180.
Peterson, G. E., and Barney, H. L. (1952). “Control methods used in a study of the vowels,” J. Acoust. Soc. Am. 24, 175–184.
Smith, D. R. R. and Patterson, R. D. (2005). “The interaction of glottal-pulse rate and vocal-tract length in judgements of speaker size, sex, and age,” J. Acoust. Soc. Am. 118, 3177-3186.
Smith, D. R. R., Patterson, R. D., Turner, R., Kawahara, H. and Irino, T. (2005). “The processing and perception of size information in speech sounds,” J. Acoust. Soc. Am. 117, 305-318.
Turner, R. E., Walters, T. C. and Patterson, R. D. (2004). “Estimating vocal tract length from formant frequency data using a physical model and a latent variable factor analysis,” Poster P61, British Society of Audiology short papers meeting, London, UK
van Dinther, R. and Patterson, R. D. (2006). “Perception of acoustic scale and size in musical instrument sounds,” J. Acoust. Soc. Am. 120, 2158-2177.
von Kriegstein, K., Warren, J.D., Ives, D.T., Patterson, R.D. and Griffiths, T.D. (2006). “Processing the acoustic effect of size in speech sounds,” NeuroImage 32 (1) 368-375.

