AIM2006ModulesIntroduction
From CNBH Acoustic Scale Wiki
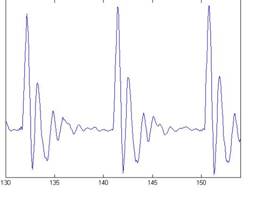
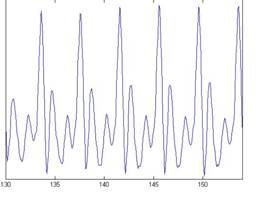
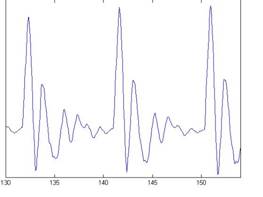
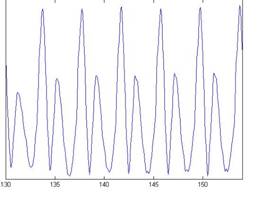
The primary concern in the examples in this document is the scaling of vowels and the normalizing of vowels scaled by STRAIGHT (Kawahara & Irino, 2004). For this purpose we use four versions of the vowel /a/ which are shown Figure 3. Each subfigure of the figure shows the waveform pertaining to a different speaker uttering the vowel sound. In the lower subfigures, the waveforms have a resonance rate of 89% of the original speaker. This corresponds to a person with a vocal tract length (VTL) of approximately 17.5 cm (6 ¾ inches) or of height of 194 cm (6'5"). In the upper subfigures are the waveforms for a resonance rate of 122% (VTL 12.7 cm or 5 inches; height 142 cm or 4'8"). The left subfigures are for a glottal pulse rate (GPR) of 110 Hz and the right subfigures for a GPR of 256 Hz. The GPR determines the pitch of the voice. The format of Figure 3 is used throughout this document to illustrate successive stages in the construction of auditory images for these four vowels, and for the size invariant Mellin magnitude images (MMI). The lower left subfigure corresponds to a large male speaker and the upper right to a small female. The lower right and upper left subfigures would correspond to somewhat unusual speakers (a castrato and a dwarf, respectively); they are included to help the reader appreciate the separate effects of a change in VTL or GPR, by identifying the salient differences between the unusual voice and the more ordinary male or female speaker.
In Figure 3, the difference in pitch is shown by the difference in pulse rate between the left and right subfigures. The effect of a resonance-rate change from 89% to 122% is most visible in the left subfigures in which the shape of the resonance following each pulse is squeezed in the upper subfigure; this is what is meant by a faster resonance rate.


