The perception of musical notes and instruments
From CNBH Acoustic Scale Wiki
|

Roy Patterson , Etienne Gaudrain, Tom Walters
This Chapter is about the sounds made by musical instruments and how we perceive those sounds. The Chapter is intended to explain the basics of musical note perception, such as, why a particular instrument plays a specific range of notes; why instruments come in families; and why we hear distinctive differences between members of a given instrument family - even when they are playing the same note. On the surface, the answers to these questions may seem obvious; one could say that brass instruments all make the same kind of sound because they are all made of brass, and the different members of the family sound different because they are different sizes. But for many musicians, this level of answer just prompts more questions, such as: What do we mean when we say the members of a family produce the same sound? What is it that is actually the same? And what is it that is different when different instruments within a family (like the trumpet and trombone) play the same melody? And why does there have to be more than one instrument in each family - the piano and organ 'families' manage with just one member each?
To answer these and similar questions, we will examine the relationship between the physical variables that determine how musical instruments produce their notes (like the length, mass and tension of a string) and the variables of auditory perception, like pitch, timbre, and loudness. The discussion reveals that there are three acoustic properties of musical sounds, as they occur in air, that are particularly useful in (a) summarizing the action of the physical properties of instruments and their limitations, on the one hand, and (b) explaining the dimensions of musical note perception, on the other hand. Accordingly, the first section of the Chapter sets out the aspects of note perception to be explained. The second section describes the three important acoustic properties of musical notes as they pertain to note perception. The third section explains the relationship between the physical variables of note production (length, mass, tension, etc) and the acoustic variables observed in the sounds. The fourth section briefly describes the internal representation of musical sounds in the auditory system to show that the acoustic properties of sound are preserved in the auditory representation of musical notes. The fifth, and final, section reviews the relationship between the acoustic variables of sound and the auditory variables of note perception, and suggests how the standard definitions of pitch and timbre might be revised for use in discussions of the perception of musical notes and musical instruments.
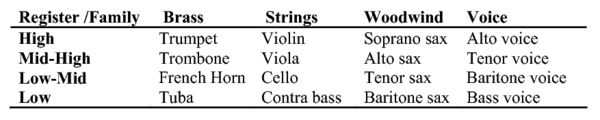
Instrument families, registers within families, and melodies
The discussion of note perception focuses on the sounds produced by the sustained-tone instruments of the orchestra and chorus, that is, the families of instruments referred to collectively as brass, strings, woodwinds, and voice. Table I shows four of the instruments in each of the families, ordered in terms of their register, or voice. With just a little training, most people can identify these sixteen instruments from a simple melody (van Dinther and Patterson 2006). From this perspective, the purpose of the chapter is to explain how auditory perception enables us to make these distinctions.
When members of different instrument families play the same note - say a trombone, a cello, a bassoon, and a baritone all produce their version of C3 (the C below middle C on the keyboard) - it is the pitch of the notes that is the same and it is the timbre of the notes that is different. This is the traditional distinction between the perceptual variables pitch and timbre. The instruments of a given family have similar physical shapes, they are made of similar materials, and they are excited in similar ways, so it is not surprising that the instruments of a family produce a category of notes with a distinctive, unifying, sound quality, or timbre. The categories of timbre associated with instrument families are labelled with words that describe some physical aspect of the source. So, the trumpet is a brass instrument, the clarinet is a wood-wind instrument, and the violin is a string instrument. The family aspect of timbre is largely determined by the shape of the envelope of the magnitude spectrum and the pitch is largely determined by the repetition rate of the note. So, these aspects of note perception would appear straightforward. Within a family of instruments, the different members are distinguished physically by their size and perceptually by their register: soprano, alto, tenor, baritone or bass. Register is a very important aspect of note perception, but it is not as straightforward as pitch and instrument family because there are two separate aspects of instrument size involved in determining the perceived register of an instrument.
The first aspect of instrument size associated with the perception of register is the size of the source that activates, or excites, the instrument. In the string family, for example, it is the bow pushing on an individual string that excites the instrument, and it is primarily the length, mass, and tension of the string that determine the note that is produced. Together, these physical variables determine the repetition rate of the vibration that the instrument produces. Repetition rate is one of three acoustic properties that are important in musical note perception. It is a major determinant of the perceived register of an instrument, as well as the prime determinant of the pitch of a note. Register and pitch are two different aspects of note perception, and this is one of the distinctions that the chapter is intended to explain. At this point, it is sufficient to note that the musician varies the length of the string by depressing it against the neck of the instrument to vary the repetition rate and produce a melody. The three physical variables, length, mass and tension, are used by instrument makers to set the four open-string notes on each instrument, and the repetition rates of the open-string notes play a large role in establishing the register of the instrument.
The second aspect of instrument size associated with the perception of register is the size of the resonators in the body of the instrument; together, the resonators filter the pulse stream produced by the source. In the string family, the filter is primarily the bridge and face plate in conjunction with the volume of air in the body of the instrument and the f holes in the face plate. Acoustically, the resonances of the filter give the frequency spectrum of the note a distinctive shape which is closely associated with the sound quality, or timbre, of the instrument family. Spectral shape is the second of the three acoustic properties that are important in musical note perception. The spectrum also contributes to the perception of register. Within a family, if the spectrum is plotted on a logarithmic frequency axis, the distribution of activity shifts towards the origin without changing its basic shape, as the size of the instrument increases. Thus, the position of the spectral pattern contributes to the perception of instrument register, and the position of the spectral pattern is the last of the three acoustic properties that are important in musical note perception.
In general terms, then, the purpose of this chapter is to describe how the physical variables of note generation are related to the acoustic variables of notes as sounds, and how these acoustic variables are related to the perception of melodies, the perception of instrument family, and the perception of instrument register.
Pulse-resonance sounds and acoustic scale
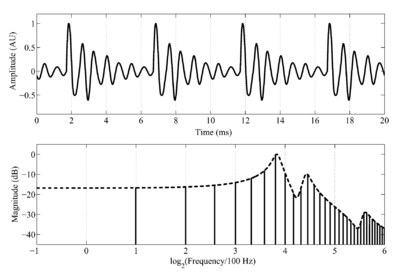
The acoustic variables that are important to the discussion of music perception are conveniently illustrated with the sustained notes produced by singers, that is, sustained vowels. This also provides an opportunity to introduce the voice as a family of musical instruments. The waveform and spectrum of a synthetic /a/ vowel, like that spoken by a child, are presented in the upper and lower panels of Fig. 1, respectively. The waveform shows that a vowel is a stream of glottal pulses, each of which is accompanied by a decaying resonance that reflects the filtering of the vocal tract above the larynx. The set of vertical lines in the lower panel of Fig. 1 shows the long-term magnitude spectrum of the sound, and the dashed line connecting the tops of the vertical lines shows the spectral envelope of the vowel. In this example, the glottal pulse rate (GPR) is 200 pulses per second (pps), so the time between glottal pulses in the upper panel of Fig. 1 is 5 ms, and the spacing between the harmonics that form the fine structure of the spectrum in the lower panel is 200 Hz. The resonances in the spectral envelope are the formants of the vowel; the shape of the envelope in the spectral domain corresponds to the shape of the damped resonance in the time domain.
When children begin to speak they are about 0.85 meters tall, and as they mature their height increases by about a factor of two. The GPR of the voice decreases by about an octave as the child grows up and the vocal cords become longer and more massive. The decrease is greater than an octave for males and less than an octave for females; on average it is more than an octave but much less than two octaves. A person's vocal tract length increases in proportion to their height (Fitch and Giedd 1999; Turner et al. 2009 , their Fig. 4), and so the formant frequencies of children's vowels decrease by about an octave as they mature (Lee et al. 1999; Turner et al. 2009).
The effect of growth on the spectrum of a vowel is quite simple to characterize, provided the spectrum is plotted on a logarithmic frequency scale. In this case, the set of harmonics that define the fine structure of the spectrum simply moves, as a unit, towards the origin as the child matures into an adult, by somewhat more than one octave. In speech, the pattern of formants that defines a given vowel type remains largely unchanged as people grow up (Peterson and Barney 1952; Lee et al. 1999; Turner et al. 2009). So the shape of the spectral envelope does not change as a child grows up, the envelope just shifts towards the origin by about an octave, without changing shape.
These shifts in the fine structure and the envelope of the vowel do not change our perception of the vowel type; in the current example, the vowel remains an /a/, and does not change to an /e/, an /o/ or an /u/, as the size of the singer changes. The shifts do, however, have systematic effects on our perception of who is singing and what melody they are singing, so they are important variables in the perception of music. In acoustic terms, 'the position of the fine-structure of the spectrum on a logarithmic frequency scale' is the acoustic scale of the fine structure, and it is closely associated with the physical variables that control the source of excitation - the vocal folds - and the rate at which they vibrate. The position of the fine structure is a property of the sound as it occurs in the air (Cohen, 1993) - a property that appears in the time domain as the Glottal Pulse Rate (GPR) of the speaker. For brevity, it will be referred to as 'the scale (S) of the source (s)' and designated Ss. Similarly, in acoustic terms, 'the position of the envelope on a logarithmic frequency scale' is the acoustic scale of the set of resonances in the vocal tract that produce the formants in the spectrum; this is another property of the sound, and in this case, the most relevant physical variable is the speaker's vocal tract length (VTL). For brevity, this property will be referred to as 'the scale (S) of the filter (f)' and designated Sf. Turner et al. (2009) have recently reanalysed several large databases of spoken vowels and shown that almost all of the variability in formant frequency data that is not vowel-type information is Sf information.
When vowel type changes, e.g., from /a/ to /i/, the shape of the envelope changes, so the different vowel types are, in some sense, like different instrument families; however, the set of vowel types is like a cluster of families that is, nevertheless, distinct from the other musical families. In auditory terms, since different vowels can be sung by the same person on the same note, vowel-type is like family timbre, and since singers of with different vocal registers, e.g., alto and baritone, can sing the same vowel, vocal register is essentially the same as instrument register.
Pulse-resonance sounds and the source-filter model of musical sounds
This section of the chapter reviews the "source-filter" model of musical sound generation as it pertains to several families of musical instruments. The sustained-tone instruments of the orchestra produce pulse-resonance sounds whose basic properties are similar to the vowel illustrated in Fig. 1; that is, a source within the instrument produces a temporally regular stream of pulses and, then, resonators in the body of the instrument filter the pulses and introduce the spectral resonances that give the note, and thus, the instrument, its distinctive timbre. In this section, the source-filter model is used to illustrate the relationship between the physical properties of the instrument, on the one hand, and the three main acoustic properties of these sounds, on the other hand.
The source of excitation and the acoustic variable, Ss
In general terms, the source in these instruments is a highly nonlinear resonant system that produces a temporally regular stream of acoustic pulses similar to a click train. The systems themselves are quite diverse. For example, in the voice, it is the vocal folds; in brass instruments, it is the lips coupled to the mouth piece; in the woodwinds it is the reed coupled to the lips; and in string instruments, it is the bow coupled to one of the strings. Despite the diversity of mechanisms, all of the sources produce streams of very precise pulses and this virtually ensures that the waves produced by sustained-tone instruments are pulse-resonance sounds, like vowels. [In Fourier terms, the overtones of the pulse rate are locked to the pulse times both in frequency and phase up to fairly high harmonic numbers.]
The acoustic scale of the source of excitation, Ss, is the repetition rate of the wave as it occurs in the air between the instrument and the listener. Ss is determined by physical properties of the instrument, like length and mass, which are not themselves acoustic variables. Ss largely determines the pitch we hear, but Ss is not an auditory variable. It is an intervening, acoustic variable that describes a property of the sound in air, and it should be distinguished from pitch which is the auditory variable of perception. The relationship between Ss and the physical variables of the instrument will be illustrated by comparing how Ss is determined in the vocal tract and in stringed instruments.
The source of excitation in the human voice
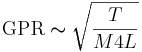
The vocal folds produce glottal pulses in bursts and, although the vocal folds are rather complicated structures, the effect of the physical variables on the rate of pulses can be calculated using the expression for a tense string. The glottal pulse rate, GPR, is largely determined by the length, L, mass, M, and tension, T, of the vocal folds, and the form of the relationship is
 (1)
(1)
Two of these physical variables are determined by the size of the person - the length and mass of the vocal folds. Both of these variables increase as a child grows up, and both of these terms are in the denominator on the right-hand side of the equation, so as the child increases in height the pitch of the voice decreases. The average GPR for small children is about 260 Hz, both for males and females. For females GPR just decreases with height throughout life dropping to, on average, about 160 Hz in women. For males, GPR decreases with height until puberty at which point the vocal folds suddenly increase in mass and the GPR drops to, on average, about 120 Hz in men. So it is the length and mass of the vocal folds that primarily determine whether a person is a soprano, alto, tenor, baritone or bass.
To produce a melody within their specific register, a singer varies the tension of the vocal folds. So learning to sing in tune is largely a matter of learning to control the tension of the vocal folds, holding the tension fixed during sustained notes and changing it abruptly between notes. Tension is in the numerator of the expression, and so as you increase the tension, you increase the GPR. There is considerable overlap in the note ranges of the vocal registers; in fact, the highest note of a bass is typically a note or two above the lowest note of a soprano. Finally note that the effect of all of these variables is restrained by the fact that it is the square root of the product of the physical variables that determines the specific GPR value. So, for example, a singer has to change the tension of the voice by a factor of sixteen to produce a two octave range of notes.
In summary, for a specific individual, their size, in the form of the length and mass of their vocal folds, determines their long-term average GPR, and the Ss component of the register of their voice. Varying the GPR to produce a melody involves varying the tension of the vocal folds, and thus, it also changes Ss. So the long-term average GPR, calculated over a sequence of musical phrases determines the register of the singer's voice, and short term changes in Ss are used to produce melodies.
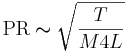
The source of excitation in the string family
The excitation mechanism in stringed instruments is the string pushed by the bow. As the musician draws the bow across a string, the string is pushed or pulled away from its resting position until the tension becomes too great and then it snaps back to its resting position, vibrating in the process. The string and bow actually produce a coupled system that includes the musician, and over the first 50 ms or so of the note, the resonant properties of the string force the system to produce a standing wave. The shape of the cycle is unusual; it is the offset of each cycle that is abrupt rather than the onset, but the result is, nevertheless, a pulse-resonance sound. Although the bow-string system is rather complicated physically (McIntyre, 1983), the relationship between the rate of pulses and the main physical variables is the same as for the vocal folds, namely,
 (2)
(2)
In this case, however, T, M, and L are the Tension, Mass and Length of the string, rather than the vocal folds. The two physical variables associated with the size of the source (the length and mass of the string) are the most important variables in this family of instruments and they each have two roles to play. Consider first the pulse rates of the open-strings on these instruments, and note that both the mass and length terms are in the denominator on the right-hand side of the equation, so increases in size, be they length or mass, lead to decreases in pulse rate. For a given member of the family (violin, viola, cello or contra bass), the length of the four strings is fixed, and as the size of the instrument increases, the string length gets longer in large steps. As a result, string length plays an important role in determining the register of the instrument. The mass of the string increases with its length, so it also contributes to the perceived register. But mass also plays another important role within the set of strings on an individual family member; the mass is varied across the strings to produce different note ranges on the four strings. Finally, the musician varies the length of individual strings to get the different notes within that string's range.
Instrument makers are very adept at using mass and length to vary the pulse rate of notes within a family. If a musician shortens the lightest string on the largest instrument, the contra base, to a point near the end of the neck, the pulse rate of the note will actually be a little higher than the pulse rate of the open-string note of the heaviest string on the smallest member of the family, the violin. These are the notes just below middle C on the keyboard.
Excitation mechanisms of the woodwind and brass instrument families
The excitation of woodwind and brass instruments is described in terms of fluid mechanical 'valves' that momentarily close the flow of air through the instrument. The closure causes a sharp acoustic pulse which resonates in the body of the instrument. For woodwind instruments, the valve is the reed in conjunction with the lips. For brass instruments, the source is not clearly localised within the instrument. The source of energy is the stream of air produced by the player who controls the pressure with the tension of the lips. The source of excitation is pulsatile because the mouthpiece is coupled to the tube between the mouthpiece and the bell (i.e. the body of the instrument), and the tube can only resonate at certain frequiencies. Thus, the pulses originate from the lips, but the pulse-rate is effectively determined by the length of the instrument, and the length is varied by the valves or slide to control the pulse rate of the note. In any event, these two families of instruments also produce pulse-resonance sounds in which the acoustic scale of the source controls the repetition rate of the note, and thus, the Ss component of the instrument's register. The pulsive nature of the excitation generated by these systems, and the temporal regularity of the pulse stream, mean that the dominant components of the spectrum are strictly harmonic and they are phase locked (Fletcher and Rossing 1998). Fletcher (1978) provides a mathematical basis for understanding what is referred to as mode locking in musical instruments. Detailed descriptions of the mechanisms are provided in, for example, Benade (1976), Fletcher (1978), and McIntyre et al. (1983); a brief overview is provided in van Dinther and Patterson (2006).
Summary of the role of Ss in the perception of melody and register
Comparison of the excitation mechanisms for the different instrument families shows that the mechanisms are similar, inasmuch as they all produce regular streams of sharp pulses and the pulse rate is affected in the same way by the size of the components in the source; specifically, the pulse rate decreases as the size of the components increases. At the same time, the method whereby the pulse rate is varied to produce a melody is fundamentally different: the variable that controls pulse rate in the voice is the tension of the vocal folds, and the singer increases the tension to increase the pulse rate; whereas the variable that controls pulse rate in string instruments is string length, and the musician decreases the length to increase the pulse rate. The brass and woodwind instruments are like the strings, inasmuch as the pulse rate is varied to produce a melody varying length rather than tension; they are different from the strings inasmuch as the length in this case is tube length rather than string length.
This brief overview of excitation mechanisms is intended to illustrate that, although different instrument families employ very different mechanisms to produce a regular stream of sharp pulses, and it is important for musicians to understand something of these mechanisms in order to play their instruments properly, nevertheless, all of these instruments produce pulse-resonance sounds, and the melody information in music is a sequence of pulse-rate values that specify the momentary acoustic scale of the source of excitation. Although the relationship between the physical variables involved in instrument excitation and the repetition rate of a given note is complex, the relationship between the acoustic variable, Ss, which summarizes the action of the source, and the pitch we perceive is straightforward. Indeed, the relationship is so direct that we usually use the units of acoustic scale, Hz or pulses per second, as the units for the auditory variable, pitch.
The filtering of the excitation pulses and the acoustic scale of the filter, Sf
Each of the pulses produced by the excitation mechanism of a sustained-tone instrument is filtered by body resonances within the instrument, and it is these body resonances that produce the resonances we observe following the pulses in the waveform. The resonances also produce the distinctive shape of the envelope in the frequency domain, and ultimately, the timbre of the instrument family. For stringed instruments, the prominent resonances are associated with the plates of the body (wood resonances), the body cavities (air resonances), and the bridge (Benade 1976). For brass and woodwind instruments, the prominent resonances are associated with the shape of the mouthpiece, which acts like a Helmholtz resonator, and the shape of the bell which determines the efficiency with which the spectral components radiate into the air (Benade and Lutgen 1988). Woodwind instruments have a tube resonance like brass instruments, but the filtering is complicated by the 'open-hole cutoff frequency' for woodwinds. The dominant resonances of speech sounds are determined by the shape of the vocal tract (Chiba and Kajiyama 1941; Fant 1960). So, just as there are many source mechanisms for generating the pulse stream, so there are many systems of body resonances to produce distinctive spectral envelopes.
Within a family, the most prominent distinction between the members of the family is the size of the body of the instrument, and the primary effect of instrument size on the perception of register is straightforward: If the size of an instrument is changed while keeping its shape the same, the result is a proportionate change in Sf, the acoustic scale of the filter mechanism in the body of the instrument. That is, if the three spatial dimensions of an instrument are increased by a factor, a, keeping the materials of the instrument the same, the natural resonances decrease in frequency by a factor of 1/a. The shape of the spectral envelope is preserved under this transformation, and so, if the spectral envelope is plotted on a log-frequency axis, the envelope shifts as a unit towards the origin, without changing shape, and the change in Sf will be the log of the relative size of the two instruments. This uniform scaling relationship is called 'the general law of similarity of acoustic systems' (Fletcher and Rossing 1998), and it is used to produce much of difference in Sf between instruments. Numerical examples illustrating how the spatial dimensions of an instrument affect its resonances are provided by van Dinther and Patterson (2006) for two specific forms of resonator, Helmholtz resonators and flat plates.
Comparison of the filter systems of the different instrument families shows that the spectral envelope is affected in the same way by changes in the size of the filter-system components; specifically, the resonant frequencies decrease as body size increases and so the spectral envelope shifts towards the origin as the sizes of the components increase. So size affects the filter system in the same way as it affects the excitation mechanism, simply because bigger things vibrate more slowly. The wood-plate and bridge resonances of the string-family filter system are complex, and they are fundamentally different from the bell and mouth piece resonances of the brass-family filter system, which are also complex. Despite the complexity of the relationship between the physical variables involved in body filtering and the shape of the resultant spectral envelope, the relationship between the acoustic properties and the perception of the notes is fairly straightforward; the shape of the envelope determines the sound quality, or family timbre, the acoustic scale of the filter, Sf, summarizes the filter component of the perception of register. In all of these instrument families, the register decreases from soprano to base as instrument size increases and the spectral envelope shifts toward the origin.
Acoustic scale and register range
In sections 3.1 and 3.2, the relationship between the physical variables involved in the production of musical notes, and the acoustic scale of the source and filter, was presented in theoretical terms without reference to the practicalities of constructing and playing instruments. It turns out, that it is not possible to simply scale the spatial dimensions of instruments to achieve registers ranging from soprano to base in most instrument families; the base member would be too large and the soprano member to small. This section reviews the spatial scaling problem, and describes how the instrument makers produce notes with a wide range of acoustic scale without using excessively large or small instruments. The spatial scaling problem arises from the desire to simultaneously satisfy three design criteria for families of sustained-tone instruments:
The first criterion is that instruments should produce notes which are heard to have a strong musical pitch whose clarity and salience provide for effortless communication of novel melodies. This places an important constraint on the relationship between the acoustic scale variables, Ss and Sf. The instrument's filter system must resonate at frequencies corresponding to the first eight harmonics of the pulse rate of each note that the instrument is intended to play; that is, the instrument must emit significant amounts of acoustic energy in the range from the pulse rate of each note to three octaves above that pulse rate. This is necessary because the pitch of notes where the energy is carried by harmonics above about the tenth is not sufficiently salient to support accurate perception of novel melodies (Krumbholz et al. 2000; Pressnitzer et al. 2001). The second criterion is that the members of each instrument family should, together, produce notes that cover a significant portion of the musical scale, which for the keyboard encompasses about seven-octaves from about 27.5 - 3520 Hz. When combined with the first criterion, the second criterion effectively requires that the instruments of a given family have matched Ss and Sf values for all of the registers in the range from soprano to bass. This is a very demanding constraint, particularly when combined with the third criterion, which is that the instruments should be playable and portable. This last, practical constraint places limitations on the sizes of instruments which, in turn, means that the desired range of notes cannot be achieved by simply scaling instrument size in accordance with the law of acoustic similarity.
There are problems for the instrument maker at both ends of the register range. For example, in the string family, there is a limit to how short the neck can be on the violin if the contact points for the notes are to be spaced far enough apart for a musician to play the instrument accurately and quickly. And at the other end of the range, if the instrument maker attempts to scale up the soprano version of the family to provide the bass member, the instruments become too large to play and too large to carry. Hutchins (1967, 1980) described the problems encountered when you try to construct a family of eight stringed instruments covering the entire range of orchestral registers based on the properties of the violin. The double bass member of the family would have to be six times the size of the violin, if simple scaling of instrument dimensions were to be used to provide a shift of six octaves in the spectral envelope. The length of a violin is about 0.6 m, so the double bass in this hypothetical family would have to be 3.6 m tall. The lower notes on the strings of such a double bass would not be reachable for most musicians and the instrument would not be portable. So, although instrument makers scale the dimensions of instruments to achieve much of the desired change in Ss and Sf, it is not possible to use the scaling of spatial dimensions, on its own, to provide the full range of registers in each family, and at the same time, ensure that the pitch of each note is sufficiently strong to support novel melody perception.
So, how do the instrument makers construct families of instruments that produce notes with salient pitches over the full range of registers from soprano to bass, and which are, at the same time, playable and portable? The first criterion of instrument production is immutable; the instrument must produce energy in the first three octaves of the pulse rate if the note is to have a well defined pitch. The third criterion is essential; the instruments have to be playable and portable. So how do the instrument makers provide such a wide range of notes on instruments with manageable sizes? This is where the knowledge and craft of the instrument maker come to the fore. What is required is not that the soprano instruments be excessively small and the bass instruments be excessively large; what matters is that the instruments produce notes with a wide range of Ss and Sf values, and that the Ss and Sf values are coordinated throughout the range. So what the musicians have done is find ways of extending the range of Ss and Sf, beyond what is practical with spatial-dimension scaling, by adjusting other physical properties of the instruments such as the mass of the strings, the thickness of the plates or the depth of the whole instrument. They scale the physical dimensions of the family so that the largest member is portable and the smallest member is playable, and then they adjust other physical properties of the instrument to achieve the desired acoustic scale values for the source mechanism and the filter system (e.g. Schelleng 1963).
With regard to the source of excitation in the string family, the strings on the larger members are not as long as the law of acoustic similarity would require because it would make the instruments unwieldy. The instrument makers increase the linear mass of the strings (the mass per meter) by increasing their diameter and by winding metal coils around the string. The increased linear mass causes the strings to vibrate more slowly as dictated by equation 2. The instrument makers use a change in mass to obtain the lower ranges of notes on the lower strings of any given member of the family. Comparison of the top and bottom strings on the violin will be used to illustrate the point. The highest string is tuned at a pulse rate of 660 pps (E5) while the lowest one is tuned at 196 pps (G3) -- a pulse-rate ratio of 3.4. The typical linear mass for the E5 string is about 0.4 g/m, and its tension is generally around 77 N. For the G3 string, these values are 2.4 g/m and 40 N. The pulse rates of the two strings can be calculated from equation 2, and it is found to be 3.4, as required.
With regard to the filter systems in the string family, the filter systems of the larger members of the family are not as large as the law of acoustic similarity would require, because it would make the instruments too heavy and too large. The instrument makers adapt the characteristics of the instruments to preserve the sound quality while making them usable at the same time. The main resonance is driven by the cavity mode of the body which then work as a Helmoltz resonator. The volume of the instrument as well as the surface of the f holes are then the key parameters. The open strings of the cello are tuned to pulse rates three times lower than those of the violin. However, the plates of the body are only 2.1 times larger than those of the violin (Schelleng 1963), while the rib height of the cello is about four times that of the violin (Fletcher and Rossing 1998). The volume of the cello is, then, 17 times larger than that of the violin; this is equivalent to uniform spatial scaling by a factor of 2.6. To lower the body resonances to the desired values, the instrument makers vary the mass, thickness and arching of the body plates. Specifically, the body plate of the cello is made proportionally thinner than that of the violin which lowers the body resonance frequency (Molin et al. 1988).
Finally, note that that the range of notes covered by the vocal registers, from soprano to bass, is only about four octaves in total (from about C6 down to a little over C2), while the string family covers almost seven octaves (from just under C8 to just over C1. The singing teacher can help a vocalist strengthen notes at the end of their natural range, but they cannot stretch the vocal tract length or add significant mass to the vocal folds. (As an aside, when you have a cold, the phlegm adds mass to the vocal cords which is why you can hit lower notes than normal for a few days.)
The auditory representation of pulse-resonance sounds and acoustic scale
There are now a number of time-domain models of auditory processing that attempt to simulate the neural response to complex sounds like musical notes at a succession of stages in the auditory pathway (Slaney and Lyon 1990; Meddis and Hewitt 1991). One of them specifically attempts to simulate the neural representation of sound that forms the basis of our first conscious perception of a sound - a representation that is referred to as the initial auditory image of the sound (Patterson et al. 1992; Patterson et al. 1995). This Auditory Image Model (AIM) will be used to illustrate the form that the acoustic properties of musical sounds are thought to take at the level of primary auditory cortex in the brain (e.g., Patterson et al. 2002).
The auditory image of a sound is constructed in four stages: First, a weighting function somewhat like the loudness contour is applied to the input signal to simulate the effect of the outer ear and the ear canal on incoming sound (Glasberg and Moore 2002) - a function that largely determines the lower and upper frequency limits of hearing in young listeners. Then a spectral analysis is performed with an auditory filterbank to simulate the operation of the basilar partition in the cochlea. In the current version of AIM, it is a compressive, gammachirp auditory filterbank (Irino and Patterson 2001; Patterson et al. 2003); the gammachirp filter is asymmetric and the asymmetry varies with stimulus level, as dictated by human masking data (Unoki et al. 2006). In the dynamic version of this gammachirp filter (Irino and Patterson 2006), a form of fast-acting compression is incorporated into the auditory filter itself. The compression responds to level changes within the individual cycles of pulse-resonance sounds and, as a result, the filter restricts the amplitude of the pulse and emphasizes the resonance within the cycle (Irino and Patterson 2006 , Figs 7 and 9). The wave at the output of each gammachirp filter is rectified and lowpass filtered to simulate neural transduction, and the result is a simulation of the aggregate firing of all of the primary auditory nerve fibres associated with that region of the basilar membrane (Patterson 1994 a). The set of transduced waves from all of the auditory filters is referred to as the Neural Activity Pattern (NAP) and it simulates the output of the cochlea in response to a given sound. Each cycle of a pulse-resonance sound produces a distinct vertical ridge in the NAP followed by decaying resonances in the formant regions of the spectrum. An example of the NAP produced by a sustained vowel is presented in Patterson et al. (1995).
Although the neural patterns produced by vowels and musical notes in the NAP repeat with the period of the wave, we hear perfectly stable perceptions when presented with sustained vowels or musical notes. In AIM, the conversion of the oscillating NAP into a stabilized auditory image is simulated with a functional model of the temporal integration referred to as 'strobed temporal integration.' The process effectively calculates the time intervals between peaks in each channel of the NAP as it flows from the cochlea, and these time intervals are entered into a dynamic time-interval histogram, one for each channel of the filterbank (Patterson, 1994b). The array of time-interval histograms is the auditory image. A brief summary of the successive simulations in AIM is presented in Patterson et al. (1995). The auditory image is similar in form to an autocorrelogram (Slaney and Lyon 1990; Meddis and Hewitt 1991; Yost 1996) but strobed temporal integration involves far less computation and it preserves the temporal asymmetry of pulse resonance sounds which autocorrelation does not Patterson and Irino (1998).
The auditory image produced by a baritone singing the vowel /a/ on the note G2 is presented in Figure 3a, and for comparison, the auditory image for a French horn playing the same note is shown in Figure 3b; the pulse rate is 98 Hz in both cases. The figure is reproduced from the paper of van Dinther and Patterson (2006). The auditory images are the central 'waterfall' plots in Figure 3a and 3b. The vertical ridges in the 10-ms region of the images, and the resonances attached to these ridges, provide a vertically-aligned representation of one cycle each note, as it appears in the NAP, and it is this pattern that repeats in the NAP for as long as the note is held.

The spectral profile and the acoustic scale of the filter
While the processing of pulse-resonance sounds up to the level of our initial perception of them may seem complicated, the relationship between the acoustic properties of these sounds, as observed in their waves and log-frequency spectra, and the features that appear in the auditory images of pulse-resonance sounds is relatively straightforward. The spectral profile to the right of each auditory image is the average of the activity in the image across time interval; it simulates the distribution of activity along the basilar membrane in the cochlea. The frequency axis is quasi-logarithmic like the tonotopic dimension of the cochlea (Moore and Glasberg 1983). The three peaks in the spectral profile of the baritone note show the formants of the vowel; the pattern is similar to that of the child's vowel in Figure 1b, but the pattern in the profile of Fig. 3a is shifted towards the origin with respect to that in Figure 1b because the singer is an adult in Figure 3a. So the spectral profile of the auditory image is similar in form to the envelope of the magnitude spectrum. It is a covariant representation of the family and register information (van Dinther and Patterson 2006) in which the family information is contained in the shape of the envelope and the register information, Sf, is represented by the position of the envelope along the frequency axis. Comparison of the spectral profiles for the voice and French horn (Figure 3a and 3b) shows that, whereas the spectral envelope of the voice is characterized by three distinct peaks, or formants, the envelope of the French horn is characterized by one broad region of activity. Note that the spectral profile of the auditory image is similar to an excitation pattern (Zwicker 1974; Glasberg and Moore 1990), insofar as it illustrates the distribution of activity along the tonotopic axis in the auditory system beyond the cochlea.
The time-interval profile and the acoustic scale of the source
The resolution of the auditory filter, at the sound levels where we normally listen to music, is not sufficient to define individual harmonics of pulse-resonance sounds beyond the first two or three. As a result, the fine structure of the magnitude spectrum is not readily apparent in the spectral profile of the auditory image for musical sounds. However, the temporal information in the sound is present in the auditory image itself. The vertical ridge in the 10 ms region of each image shows that there is a concentration of time intervals at the period of the sound in most channels of both of both auditory images in Figure 3a and 3b. Thus, the acoustic scale of the source is readily observed in this simulation of the neural representation of sound, even thought the construction of the auditory image includes a temporal integration process with a half life of 30 ms. Strobed temporal integration preserves the temporal fine structure of periodic components of sounds like the sustained parts of vowels and musical notes.
Moreover, the temporal information associated with the acoustic scale of the source is both preserved and enhanced in the time-interval profile below the auditory image, which shows the activity averaged across filter channels. In this time-interval profile, the position of the largest peak (in the region beyond about 1.25 ms) provides an accurate estimate of the period of the sound (for G2, ~10ms). Moreover, the height of the peak, relative to the level of the background at the foot of the peak, provides a good measure of the degree of periodicity in the sound (Patterson and Holdsworth 1996; Patterson et al. 2000; Ives and Patterson 2008). Thus, in time-domain models involving auditory images or autocorrelograms, the most obvious correlate of the acoustic scale of an instrument's source, Ss, is a concentration of time intervals at a particular value, and this form of the information is more like the time between peaks in the sound wave (Figure 3a), rather than the position of the fine structure in the magnitude spectrum of the sound (Figure 3b).
Summary of the acoustic scale information in the auditory image
There are multi-panel figures in van Dinther and Patterson (2006) which show how the auditory images of the voice and the French horn change as the acoustic scale of the source and the acoustic scale of the filter vary. Basically, the figures show what would be expected from the discussion of acoustic scale above and in Section 2: The main vertical ridge in the auditory image and the corresponding peak in the time-interval profile, move left to longer time intervals as the pulse rate of the voice or the French horn decreases, and to the right to shorter time intervals as the pulse rate increases. When the peak stands out clearly in the time-interval profile well above the background activity, the sound is effectively periodic. The multi-panel figures also show that, when the scale of the filter changes, the complex pattern in the auditory image simply moves up or down without changing shape, and similarly, the distribution of activity in the spectral profile of the image moves up or down without changing shape.
The acoustic properties of pulse-resonance sounds and the auditory variables of perception
The final section of this Chapter reviews the relationship between the acoustic properties of sound and three variables of auditory perception, loudness, pitch and timbre, to illustrate how they relate to the variables of music perception described in the sections above, namely, melody, instrument family and instrument register. The American National Standards Institute (ANSI) has provided official definitions of loudness, pitch, and timbre, and these definitions are widely quoted. The Section begins with these definitions since they might have been expected to specify just those relationships between physical and perceptual variables that we require to explain the perception of musical notes. The definitions are:
12.03 loudness. That attribute of auditory sensation in terms of which sounds may be ordered on a scale extending from soft to loud.
12.01 pitch. That attribute of auditory sensation in terms of which sounds may be ordered on a scale extending from low to high. Pitch depends primarily upon the frequency content of the sound stimulus, but it also depends upon the sound pressure and the waveform of the stimulus. Note - The pitch of a sound may be described by the frequency or frequency level of that simple tone having a specified sound pressure level that is judged by listeners to produce the same pitch.
12.09 timbre. That attribute of auditory sensation which enables a listener to judge that two nonidentical sounds, similarly presented and having the same loudness and pitch, are dissimilar. Note - Timbre depends primarily upon the frequency spectrum, although it also depends upon the sound pressure and the temporal characteristics of the sound.
["American national standard acoustical terminology" (1994). American National Standards Institute, ANSI S1.1-1994 (R1999)]
The definitions are useful, inasmuch as they illustrate the desire to relate properties of perception to physical properties of sound, and they illustrate what is regarded by auditory scientists as a principled way of proceeding with this task. Unfortunately, the definitions focus on the perceptual properties without, in the end, specifying the relationship of each to the corresponding auditory, acoustic, or physical variables, other than to say that both pitch and timbre depend primarily upon the frequency content of the sound. While true, this is not very helpful since it does not say which aspect of the frequency information is associated with which aspect of pitch and timbre. The discussion of acoustic scale in Section 2 suggests that, for musical sounds at least, we can be more specific about the relationship between the acoustic properties of sound and the perceptions associated with musical notes and instruments. Ss, the position of the fine structure of magnitude spectrum, largely determines the pitch of a musical note, and a melody is an order sequence of Ss values. The shape of the spectral envelope is closely associated with the perception of instrument family, or the family aspect of timbre. So it is envelope shape that supports the general distinction between brass and string instruments. Sf, the position of the envelope of the magnitude spectrum, combines with Ss to determine the register of the instrument. The acoustic scale variables Ss and Sf are also prime determinants of our perception of the size of an instrument or the height of a singer. In this final section of the chapter, we review the relationship between the three acoustic properties of sound and the auditory variables, pitch and timbre, with a view to developing more specific definitions of pitch and timbre for music perception.
The effect of source size on pitch and timbre
Consider the definitions of pitch and timbre, and the question of how we perceive the physical changes that take place in a vowel as a child grows up, or in a musical note as an instrument like a trumpet 'grows up' into a tuba, that is, when a note is played by successively larger members of an instrument family. The logic of the definition of timbre not entirely clear, but it would appear to involve identifying variables of auditory perception that do not affect timbre, and separating them from the remaining variables, which by default are part of timbre. The perceptual variables of particular interest are duration, loudness and pitch.
Duration is the variable that is most obviously separable from timbre, and it illustrates the logic underlying the definition of timbre (although there is not actually a standard definition of the perception of duration). If a singer holds a note for a longer, rather than a shorter, period, it produces a discriminable change in the sound but it is not a change in timbre. Duration has no effect on the magnitude spectrum of a sound, once the duration is well beyond that of the temporal window used to produce the magnitude spectrum. The sustained notes of music are typically longer than 200 ms in duration, and the window used to produce the magnitude spectrum is usually less than 100 ms, so duration is unlikely to play a significant role in family timbre or register timbre. In general, then, the perceptual change associated with a change in the duration of a sustained note is separable from changes in the timbre of the note.
Loudness is also largely separable from timbre. If we turn up the volume control when playing a recording, the change will be perceived predominantly as an increase in loudness, and vice verse. The pitch of any given vowel and the timbre of that vowel will be essentially unaffected by the manipulation. The increase in the intensity of the sound produces a change in the magnitude spectrum of the vowel - both the fine structure and the envelope shift vertically upwards - but there is no change in the frequencies of the components of the fine structure and there is no change in the relative amplitudes of the harmonics. Nor is there any change in the shape of the spectral envelope. So, loudness is also separable from timbre.
Thus, acoustic variables that do not affect either the shape of the envelope of the magnitude spectrum or the frequencies of the spectral components do not affect the timbre of the sound. The question is 'What happens when a simple shift is applied to the position of the fine structure, or the position of the envelope, of a sound (on a log-frequency axis), that is, when we change Ss, Sf, or both?' The current definition of timbre suggests that a change in Ss, which is heard as a change in pitch, does not affect the timbre of the sound, whereas a change in Sf, which is heard as a change in speaker size, does affect the timbre. This is where the current definition of timbre becomes problematic, that is, when it treats the two aspects of acoustic scale differently.
Note, in passing, that shifting the fine structure of the magnitude spectrum while holding the envelope fixed produces large changes in the relative amplitudes of the harmonics as they move through the region of a formant peak. So the relative magnitude of the components in the spectrum can change substantially without producing a change in timbre, by the current definition. Note, also, that shifting the envelope of the magnitude spectrum while holding the fine-structure frequencies fixed produces similar changes in the relative amplitudes of the components as they move through formant regions. Such shifts do not change the timber category of a musical sound (the family timbre); they change the apparent size of the source, and if the change is large enough they change the percieved register of the instrument, and this is, of course, a timbre change, by the current definition.
Acoustic-scale 'melodies' and the perception of pitch and timbre
The discussion of pitch and timbre in the remainder of the chapter is more readily understood when presented in terms of 'melodies' in which the acoustic scale values of the notes, Ss and Sf, vary according to the diatonic scale of Western music. The melodies are shown in Figure 4; all of them have four bars containing a total of eight notes. The melodies are in ¾ time, with the fourth and eight notes extended to give the sequence a musical feel. The black and grey notes show the progression of intervals for Ss and Sf, respectively, as each melody proceeds. The Ss component of the melodies is presented in the key of C major as it is the simplest to read. The melodies in the demonstration waves are actually in the key of G major. The sound files for the melodies are available at http://www.acousticscale.org/wiki/index.php/SHAR_PGW_2009_Demo_Sounds.
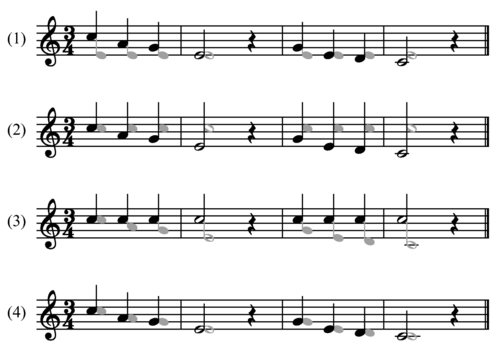
Melody 1: The first example simulates a normal melody in which the VTL of the singer is fixed and the GPR varies, so in the figure, the grey notes are fixed and the black notes vary. The singer is an adult male and the pitch of the voice drops by an octave over the course of the melody from about 200 to 100 pps [Figure 4, Staff (1)]. This descending melody is within the normal range for a tenor, and the melody sounds natural. The melody is presented as a sequence of syllables to emphasize the speech-like qualities of the source; the 'libretto' is 'pi, pe, ko, kuuu; ni, ne, mo, muuu.' In auditory terms, this phonological song is a complex sequence of distinctive timbres produced by a sequence of different spectral envelope shapes. The timbre changes engage the phonological system and emphasize the role of envelope shape in conveying the libretto of a song. As the melody proceeds, the fine-structure of the spectrum (Ss) shifts, as a unit, with each change in GPR, and over the course of the melody, it shifts an octave towards the origin. The definition of timbre indicates that these relatively large GPR changes, which produce large pitch changes, do not produce timbre changes, and this seems entirely compatible with what we hear in this melody. This illustrates the claim that pitch is largely separable from timbre, much as duration and loudness are, and much as the definition of timbre implies.
Melody 2: But problems arise when we extend the example and synthesize a version of the same melody but with a singer that has a much shorter vocal tract, like that of a small child [Figure 4, Staff (2)]. [This can be accomplished with the vocoder STRAIGHT (Kawahara and Irino 2004) which can manipulate the acoustic scale variables independently, and produce versions of notes with a wide range of combinations of Ss and Sf.] There is no problem at the start of the melody; it just sounds like a child singing the melody. The starting pulse rate is low for the voice of a small child but not impossibly so. As the melody proceeds, however, the pitch decreases by a full octave, which is beyond the normal range for a child. In this case, the voice quality seems to change and the child comes to sound rather more like a dwarf. The ANSI definition of timbre suggests that the voice quality change from a child to a dwarf is not a timbre change, it is just a pitch change. But traditionally, voice quality changes are thought to be timbre changes. This is the first form of problem with the standard definition of timbre - changes that are nominally pitch changes producing what would normally be classified as a timbre change.
Melody 3: The next example [Figure 4, Staff (3)] involves reversing the roles of the variables Ss and Sf, and using STRAIGHT to manipulate the position of the spectral envelope, Sf, while holding Ss, and thus the pitch, fixed. Over the course of the melody, the position of the envelope, Sf, shifts by an octave towards the origin. This simulates a doubling of the singer's VTL, from about 10 to 20 cm. As with the previous Ss melodies, the specific values of Sf are determined by the diatonic musical scale of Western music. In other words, the sequence of Sf ratios have the same numerical values as the sequence of Ss ratios used to produce the first two melodies. This effectively extends the domain of notes from a diatonic musical scale to a diatonic musical plane, like that illustrated in Figure 5. The abscissa of the plane is Ss or GPR; the ordinate is Sf or VTL. Both of the axes are logarithmic.
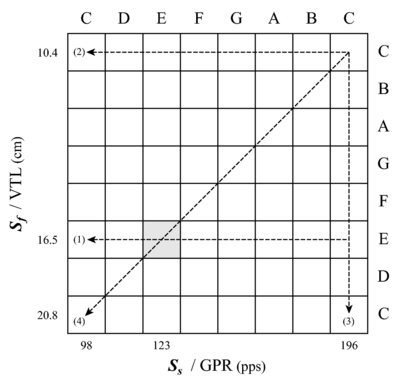
The syllables of the libretto were originally spoken by an adult male (author RP) with a VTL of about 16.5 cm and an average GPR of about 120 pps. Then STRAIGHT was used to generate versions of each syllable for each combination of Ss and Sf in the musical plane. The note corresponding to the original singer is [E, E] on this version of the Ss-Sf plane; so what we refer to as a 'C' is acoustically a 'G' (123 pps). Melody 1 was synthesized with the VTL of the original singer, that is, with notes from the E row of the plane. Melody 2 was synthesized with the VTL of a child, that is, with notes from the upper C row of the plane. Melody 3 was synthesized with a fixed pitch, upper C, and notes from the upper C column of the plane.
Perceptually, as Melody 3 proceeds and the envelope shifts down by an octave, the child seems to get larger and the voice comes to sound something like that of a counter tenor, that is, a tall person with an inordinately high pitch. The definition of timbre does not say anything specific about how changes in the spectral envelope affect timbre; the acoustic scale variable, Sf, was not recognized when the standard was written. Nevertheless, the definition gives the impression that any change in the spectrum that produces an audible change in the perception of the sound produces a change in timbre, provided it is not simply a change in duration, loudness or pitch, which are all fixed in the current example. Experiments with scaled vowels and syllables show that the just noticeable change in Sf is about 7% for vowels (Smith et al. 2005) and 5% for syllables (Ives et al. 2005), so all but the smallest intervals in the melody would be expected to produce perceptible Sf changes. Since traditionally, voice quality changes are thought to be timbre changes, the perception of the Sf melody in this example seems entirely compatible with the definition of timbre; both voice quality and timbre are changing. However, we are left with the problem that large changes in Ss and Sf both seem to produce changes in voice quality, but whereas the perceptual changes associated with large shifts of the fine-structure along the log-frequency axis are not timbre changes, the perceptual changes associated with large shifts of the envelope along the same log-frequency axis are timbre changes according to the standard definition. They both produce changes in the relative amplitudes of the spectral components, but neither changes the shape of the envelope and neither form of shift alters the libretto.
Melody 4: The problems involved in attempting to unify the perception of voice quality with the definition of timbre become more complex when we consider melodies where both Ss and Sf change as the melody proceeds. Consider the melody produced by co-varying Ss and Sf to produce the notes along the diagonal of the Ss-Sf plane. The musical notation for the melody is shown in Figure 4, Staff (4). The melody is perceived to descend an octave as the sequence proceeds, and there is a progressive increase in the perceived size of the singer from a child to an adult (with one momentary reversal at the start of the second phrase). It is as if we had a set of singers varying in age from 4 to 18 in a row on stage, and we had them each sing their assigned syllable in order, and in time, to produce the melody. The example makes it clear that there is an entire plane of singers with different vocal qualities defined by combinations of the acoustic scale variables, Ss and Sf. The realization that there is a whole plane of voice qualities makes it clear just how difficult it would be to produce a clean definition of timbre that excludes one of the acoustic scale variables, Ss, and not the other, Sf. If changes in voice quality are changes in timbre, then changes in pitch (Ss) can produce changes in timbre. This would seem to undermine the utility of the current definitions of pitch and timbre.
The second dimension of pitch hypothesis
At first glance, there would appear to be a fairly simple way to solve the problem, which is to consider the acoustic scale variable associated with the filter, Sf, to be a second dimension of pitch, which could then be excluded from the definition of timbre along with the first dimension of pitch, Ss. In this case, manipulation of the second dimension of pitch on its own would sound like the change in perception produced by Melody 3 where Ss is fixed at C and Sf decreases by a factor of two over the course of the melody. Semitone changes in the second dimension of pitch, Sf, are unlikely to be sufficiently salient to support accurate reporting of novel melodies (e.g., (Pressnitzer et al. 2001; Ives and Patterson 2008) for which pitch discrimination has to better than about 3%. This second form of pitch is more like the weak pitch associated with a set of unresolved harmonics where pitch discrimination is possible if the changes are relatively large, say 4 semitones. Nevertheless, the second form of pitch would, in some sense, satisfy the ANSI definition, which describes pitch as "That attribute of auditory sensation in terms of which sounds may be ordered on a scale extending from low to high." Moreover, it does not seem unreasonable to say that the notes at the start of Melody 3 are higher than the notes at the end, which would support the 'second dimension of pitch' hypothesis.
It does, however, lead to a problem. To determine the pitch of a sound, it is traditional to match the pitch of that sound to the pitch of either a sinusoid or a click train. It seems likely that if listeners were asked to pitch match each of the notes in Melody 3, among a larger set of sounds that diverted attention from the orderly progression of Sf in the melody, they would probably match all of the notes to the same sinusoid or the same click train, and the pitch of the matching stimulus would be the upper C. This would leave us with the problem that the second form of pitch changes the perception of the sound but it does not change the pitch (as matched). However, by the current definition, a change in perception that is not a change in pitch (or loudness, or duration) is a change in timbre. Thus, the 'second dimension of pitch' hypothesis would appear to lead us back to the position that changes in Sf produce changes in the timbre of the sound.
The 'second dimension of pitch' hypothesis also implies that if we play a random sequence of notes on the musical plane of Figure 5, the voice quality changes that we hear are all pitch changes, and there are no timbre changes. Finally, there is the problem that many people hear the perceptual change in Melody 3 as a change in speaker size, and they hear a more pronounced change in speaker size when changes in Sf are combined with changes in Ss, as in Melody 4. To ignore the perception of speaker size, is another problem inherent in the 'second dimension of pitch' hypothesis; source size is an important aspect of perception, and pretending that changes in the perception of source size are just pitch changes seems like a fundamental mistake.
The scale of the filter, Sf, as a dimension of timbre
Rather than co-opting the acoustic scale of the filter, Sf, to be a second dimension of pitch, it might make more sense to consider it as a separable, but nevertheless, internal dimension of timbre - a dimension of timbre that is associated with the perception of voice quality and speaker size. This, however, leads to a problem which is, in some sense, the inverse of the 'second dimension of pitch' problem. Once it is recognized that shifting the position of the fine structure of the spectrum is rather similar to shifting the position of the envelope of the spectrum, and that the two position variables are different aspects of the same property of sound (acoustic scale), then it somehow seems unreasonable to have one of these variables, Sf, within the realm of timbre and the other, Ss, outside the realm of timbre. For example, consider the issue of voice quality; both of the acoustic scale dimensions affect voice quality and they interact in the production of a specific voice quality. Moreover, the scale of the source, Ss, affects the perception of the singer's size, in a way that is similar to the effect of the scale of the filter, Sf. Thus, if we define the scale of the filter, Ss, to be a dimension of timbre, then we need to consider that the scale of the source, Ss, may also need to be a dimension of timbre. After all, large changes in Ss affect voice quality which is normally considered an aspect of timbre. The problem, of course, is that these seemingly reasonable suggestions lead to the conclusion that pitch is a dimension of timbre, which would seem to defeat much of the purpose of defining pitch and timbre in the first place.
The independence of spectral envelope shape
There is one further aspect of the perception of these melodies that should be emphasized, which is that neither of the acoustic scale manipulations causes a change in the libretto; it is always 'pi, pe, ko, kuuu; ni, ne, mo, muuu.' That is, the changes in timbre that give rise to the perception of a sequence of syllables are unaffected by changes in Ss and Sf, even when those changes are large (Smith and Patterson 2005; Ives et al. 2005). The changes in timbre that define the libretto are associated with changes in the shape of the envelope, as opposed to the position of the envelope or the position of the fine structure. Changes in the shape of the envelope produce changes in vowel type in speech and changes in instrument family in music. Changing the position of the envelope and changing the position of the fine structure both produce substantial changes in the relative amplitudes of the components of the magnitude spectrum, but they do not change the timbre category of these sounds, that is, they do not change the vowel type in speech or the instrument family in music.
Conclusions
The discovery that acoustic scale is a basic property of sound (Cohen 1993) leads to the conclusion that the major categories of timbre (vowel type and instrument family) are determined by spectral envelope shape, and that these categories of timbre are relatively independent of both the acoustic scale of the excitation source and the acoustic scale of the resonant filter. In speech, the acoustic scale variables, Ss and Sf, largely determine the voice quality of the speaker, and thus our perception of their sex and size (e.g., Smith and Patterson, 2005). With regard to timbre, this suggests that when dealing with tonal sounds that have pronounced resonances like the vowels of speech, it would be useful to distinguish between aspects of timbre associated with the shape of the spectral envelope, on the one hand, and aspects of timbre associated with the acoustic scale variables, Ss and Sf, on the other hand. This would lead to a distinction between the 'what' and 'who' of timbre, that is, what is being said, and who is saying it. This kind of distinction would at least represent progress towards a more informed use of the term timbre.
Acknowledgements
Research supported by the Medical Research Council (G0500221; G9900369)
References
- Benade AH (1976) Fundamentals of Musical Acoustics. Oxford University Press. [1] [2]
- Benade AH, Lutgen SJ (1988) The saxophone spectrum. J Acoust Soc Am 83:1900-1907. [1]
- Chiba T, Kajiyama M (1941) The vowel, its nature and structure. Tokyo-Kaiseikan Pub Co., Tokyo. [1]
- Cohen L (1993) The scale representation. IEEE Trans. Sig. Proc. 41:3275-3292. [1]
- Fant G (1960) Acoustic Theory of Speech Production. Mouton De Gruyter, The Hague. [1]
- Fitch WT, Giedd J (1999) Morphology and development of the human vocal tract: A study using magnetic resonance imaging. J Acoust Soc Am 106:1511-1522. [1]
- Fletcher NH (1978) Mode locking in nonlinearly excited inharmonic musical oscillators. J Acoust Soc Am 64:1566-1569. [1] [2]
- Fletcher NH, Rossing TD (1998) The Physics of Musical Instruments. Springer, New-York. [1] [2] [3]
- Glasberg BR, Moore BCJ (1990) Derivation of auditory filter shapes from notched-noise data. Hear Res 47:103-138. [1]
- Glasberg BR, Moore BCJ (2002) A model of loudness applicable to time-varying sounds. Journal of the Audio Engineering Society 50:331-342. [1]
- Hutchins CM (1967) Founding a family of fiddles. Phys Today 20:23-37. [1] [2]
- Hutchins CM (1980) The new violin family. In: Benade AH (ed), Sound Generation in Winds, Strings, Computers. The Royal Swedish Academy of Music, pp.182-203. [1]
- Irino T, Patterson RD (2001) A compressive gammachirp auditory filter for both physiological and psychophysical data. J Acoust Soc Am 109:2008-2022. [1]
- Irino T, Patterson RD (2006) A Dynamic Compressive Gammachirp Auditory Filterbank. IEEE Transactions on Audio, Speech, and Language Processing 14:2222-2232. [1] [2]
- Ives DT, Patterson RD (2008) Pitch strength decreases as F0 and harmonic resolution increase in complex tones composed exclusively of high harmonics. J Acoust Soc Am 123:2670-9. [1] [2]
- Ives DT, Smith DRR, Patterson RD (2005) Discrimination of speaker size from syllable phrases. J Acoust Soc Am 118:3816-3822. [1] [2]
- Kawahara H, Irino T (2004) Underlying principles of a high-quality speech manipulation system STRAIGHT and its application to speech segregation. In: Divenyi PL (ed), Speech separation by humans and machines. Kluwer Academic, pp.167-180. [1]
- Krumbholz K, Patterson RD, Pressnitzer D (2000) The lower limit of pitch as determined by rate discrimination. J Acoust Soc Am 108:1170-1180. [1]
- Lee S, Potamianos A, Narayanan S (1999) Acoustics of children's speech: developmental changes of temporal and spectral parameters. J Acoust Soc Am 105:1455-68. [1] [2]
- McIntyre ME, Schumacher RT, Woodhouse J (1983) On the oscillations of musical instruments. J Acoust Soc Am 74:1325-1345. [1]
- Meddis R, Hewitt M (1991) Virtual pitch and phase sensitivity of a computer model of the auditory periphery. I: Pitch identification. J Acoust Soc Am 89:2866-2882. [1] [2]
- Molin NE, Lindgren L-E, Jansson EV (1988) Parameters of violin plates and their influence on the plate modes. J Acoust Soc Am 83:281-291. [1]
- Moore BCJ, Glasberg BR (1983) Suggested formulae for calculating auditory-filter bandwidths and excitation patterns. J Acoust Soc Am 74:750-753. [1]
- Patterson RD (1994) The sound of a sinusoid: Time-interval models. J Acoust Soc Am 96:1419-1428. [1]
- Patterson RD, Allerhand MH, Giguère C (1995) Time-domain modeling of peripheral auditory processing: A modular architecture and a software platform. J Acoust Soc Am 98:1890-1894. [1] [2]
- Patterson RD, Holdsworth J (1996) A Functionl Model of Neural Activity Patterns and Auditory Images. Advances in Speech, Hearing and Language Processing Vol 3. Part B. JAI Press, London.:547-563. [1]
- Patterson RD, Irino T (1998) Modeling temporal asymmetry in the auditory system. J Acoust Soc Am 104:2967-2979. [1]
- Patterson RD, Robinson K, Holdsworth J, McKeown D, Zhang C, Allerhand M (1992) Complex Sounds and Auditory Images. In: Y Cazals L. Demany, Horner K (eds), Auditory Physiology and Perception. Pergamon Press, Oxford. [1]
- Patterson RD, Unoki M, Irino T (2003) Extending the domain of center frequencies for the compressive gammachirp auditory filter. J Acoust Soc Am 114:1529-1542. [1]
- Patterson RD, Uppenkamp S, Johnsrude IS, Griffiths TD (2002) The processing of temporal pitch and melody information in auditory cortex. Neuron 36:767-776. [1]
- Patterson RD, Yost WA, Handel S, Datta AJ (2000) The perceptual tone/noise ratio of merged iterated rippled noises. J Acoust Soc Am 107:1578-1588. [1]
- Peterson GE, Barney HL (1952) Control Methods Used in a Study of the Vowels. J Acoust Soc Am 24:175-184. [1]
- Pressnitzer D, Patterson RD, Krumbholtz K (2001) The lower limit of melodic pitch. J Acoust Soc Am 109:2074-2084. [1] [2]
- Schelleng JC (1963) The Violin as a Circuit. J Acoust Soc Am 35:326-338. [1] [2]
- Slaney M, Lyon RF (1990) A perceptual pitch detector. In: Proc. Int. Conf. Acoust. Speech and Signal Process.., pp.357-360. [1] [2]
- Smith DRR, Patterson RD (2005) The interaction of glottal-pulse rate and vocal-tract length in judgements of speaker size, sex, and age. J Acoust Soc Am 118:3177-3186. [1]
- Smith DRR, Patterson RD, Turner RE, Kawahara H, Irino T (2005) The processing and perception of size information in speech sounds. J Acoust Soc Am 117:305-318. [1]
- Turner RE, Walters TC, Monaghan JJ, Patterson RD (2009) A statistical, formant-pattern model for segregating vowel type and vocal-tract length in developmental formant data. J Acoust Soc Am 125:2374-2386. [1] [2] [3] [4]
- Unoki M, Irino T, Glasberg B, Moore BC, Patterson RD (2006) Comparison of the roex and gammachirp filters as representations of the auditory filter. J Acoust Soc Am 120:1474-1492. [1]
- van Dinther R, Patterson RD (2006) Perception of acoustic scale and size in musical instrument sounds. J Acoust Soc Am 120:2158-76. [1] [2] [3] [4] [5]
- Yost WA (1996) Pitch of iterated rippled noise. J Acoust Soc Am 100:511-518. [1]
- Zwicker E (1974) On the psychophysical equivalent of tuning curves. In: Zwicker E, Terhardt E (eds), Facts and Models in Hearing. Springer-Verlag, pp.132-140. [1]