File:GPRUS02 fig1.PNG
From CNBH Acoustic Scale Wiki
No higher resolution available.
GPRUS02_fig1.PNG (543 × 557 pixels, file size: 64 KB, MIME type: image/png)
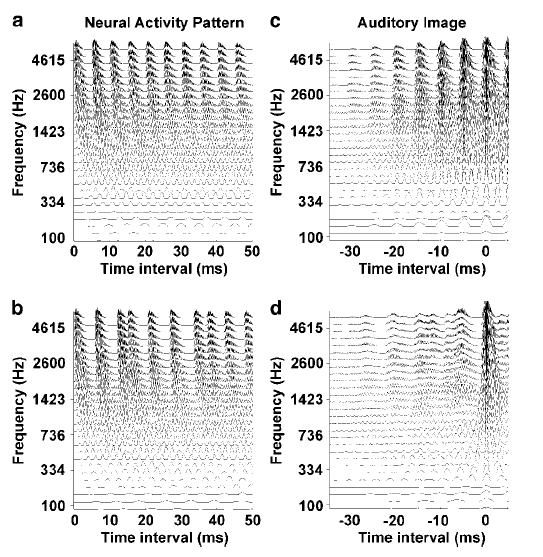
FIG. 1: Neural activity patterns (NAP) and auditory images for 5-ms regular and irregular click trains. Each line represents the activity of one auditory channel; filter bandwidth increases proportionally with center frequency. Individual clicks of the regular (a) and irregular trains (b) produce the same response in the NAP, but the structure that indicates the presence of periodicity only builds up in the auditory image of the regular train (c) and not for the irregular train (d).
File history
Click on a date/time to view the file as it appeared at that time.
| Date/Time | Thumbnail | Dimensions | User | Comment | |
|---|---|---|---|---|---|
| current | 10:23, 9 September 2008 | | 543×557 (64 KB) | AlessandroB (Talk | contribs) |
- Edit this file using an external application (See the setup instructions for more information)
File links
The following page links to this file: