File:Fig3 ISPjasa05.PNG
From CNBH Acoustic Scale Wiki
No higher resolution available.
Fig3_ISPjasa05.PNG (750 × 512 pixels, file size: 30 KB, MIME type: image/png)
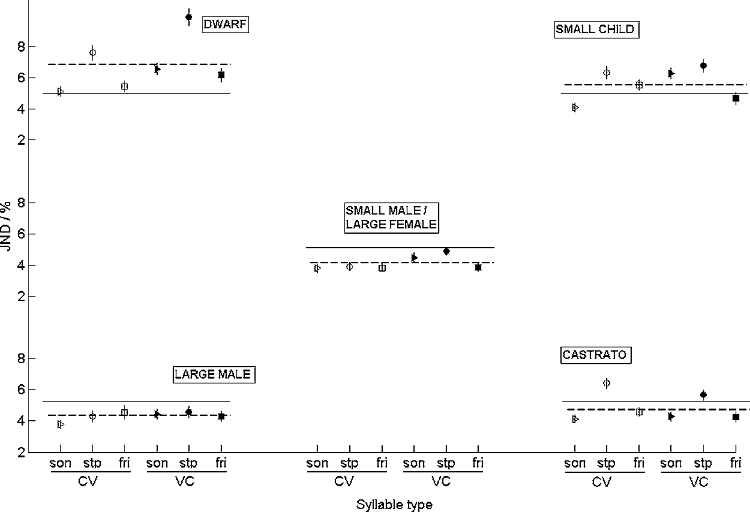
Figure 3. JND values for the six syllable groups plotted separately for the five speaker types. The layout of speaker types is the same as in Figs 2 and 3, i.e. large male at the bottom left and small child at the top right. The dotted line is the average JND across syllable category for that specific speaker type. The solid, thin line is grand average JND for the experiment plotted in each sub-figure for comparison with the local average.
File history
Click on a date/time to view the file as it appeared at that time.
| Date/Time | Thumbnail | Dimensions | User | Comment | |
|---|---|---|---|---|---|
| current | 16:49, 13 August 2008 | | 750×512 (30 KB) | AlessandroB (Talk | contribs) |
- Edit this file using an external application (See the setup instructions for more information)
File links
The following 2 pages link to this file: