A statistical, formant-pattern model for estimating vocal-tract length from formant frequency data
From CNBH Acoustic Scale Wiki
Richard Turner, Tom Walters, Jessica Monaghan, Roy Patterson
This paper investigates the theoretical basis for estimating vocal-tract length (VTL) from the formant frequencies of vowel sounds. A statistical inference model was developed to describe the relationship between vowel type and VTL, on the one hand, and formant frequency and vocal cavity size, on the other. The model was applied to two well known developmental studies of formant frequency. The results show that VTL is the major source of variability after vowel type, and that the contribution due to other factors like developmental changes in oral-pharyngeal ratio is small relative to the residual measurement noise. The results suggest that speakers adjust the shape of the vocal tract as they grow to maintain a specific pattern of formant frequencies for individual vowels. This formant pattern hypothesis is then used to develop a statistical-inference model for estimating VTL from formant frequency data. The technique is illustrated using a third developmental study of formant frequencies. The VTLs of the speakers are estimated and used to provide a more accurate description of the complicated relationship between VTL and glottal pulse rate as children mature into adults.

Contents
|
Introduction
The purpose of this paper is to establish a framework for estimating the vocal tract length (VTL) of a given speaker from small segments of their voiced speech sounds, and thereby, to establish a method for continuous estimation of VTL during speech processing. A VTL track, or contour, would assist speaker segregation and vowel normalization in multi-source environments (e.g., Welling and Ney, 2004).
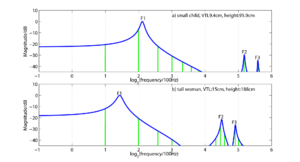
The principle is illustrated in Fig. 1 which shows the magnitude spectra (vertical green lines) of two synthetic /i/ vowels like those that might be produced by (a) a small child (about 95 cm in height) with a short vocal tract (9.4 cm) and (b) a tall woman (about 188 cm in height) with a long vocal tract (15 cm). For simplicity, the glottal pulse rate (the voice pitch), which determines the spacing of the spectral components, is 200 Hz in both cases. The spectral envelopes of the vowels are shown by the blue lines; they represent the transfer functions of the vocal tracts that produced these vowels. The soft-shouldered peaks in the envelopes represent the vocal tract resonances which are referred to as formants. The spectra and envelopes are plotted on a logarithmic frequency axis (base 2) and the reference frequency associated with a log value of 0 is 100 Hz. It is assumed that the child and the adult have formed their vocal tracts into the same shape to produce their /i/ vowels, and as a result, the pattern of formant information is the same for the two tokens of the vowel, on this logarithmic frequency axis. It is only the position of the pattern that differs; the formant pattern for the adult is shifted towards the origin, with respect to that of the child, because the vocal tract of the adult is much longer than that of the child. This very simple model of vowel development is referred to as the fixed-formant-pattern hypothesis in the current paper. It is similar to the uniform scaling hypothesis (e.g., Fant, 1966) and to formant ratio theory (e.g., Miller, 1989). The differences will be discussed below where relevant. These simple models of vowel development are important because they imply that vowel-type information and VTL information are covariant in the log-frequency vowel spectrum (Patterson, van Dinther and Irino, 2007), and this, in turn, suggests a relatively simple method for performing VTL estimation in conjunction with vowel identification. The process involves taking the formant pattern for each vowel type, in turn, and shifting it back and forth along the frequency axis to find out which formant pattern (vowel type) leads to the best fit, and the position in which it provides this best fit is achieved. The position specifies the VTL of the speaker, to within a fixed constant. Accordingly, the purpose of the paper is to review the developmental data pertaining to the spectral envelopes of vowel sounds to determine the extent to which the formant-pattern hypothesis is true, and to investigate the practical implications of estimating VTL from existing developmental data on formant patterns. Section I.A describes a quantitative reanalysis of the classic developmental data of Peterson and Barney (1952) in which the formant pattern is summarized by estimates of the first three formant frequencies, extracted from spectrograms of the vowels by humans. The analysis shows that children and adults produce vowels in which the formant pattern is, at least approximately, fixed, and the main source of variability, after vowel type, is the acoustic counterpart of VTL (i.e., acoustic scale; Cohen, 1993). This suggests that it should be possible to use the formant pattern principle to estimate VTL as outlined above from formant frequency data. However, two problems were encountered when attempting to develop a procedure for VTL estimation: (1) There was a small but significant discrepancy from fixed formant patterns in the data of Peterson and Barney (1952) which suggested the presence of another source of variability in the data. Fant (1966, 1976) observed the discrepancy some time ago in the course of investigating the uniform scaling hypothesis. He suggested that the discrepancy might be associated with the fact that the pharyngeal cavity grows proportionately faster than the oral cavity as children mature into adults. The extent of the non-uniformity of the growth of the anatomical cavities of the vocal tract is quantified in Section I.B using the Magnetic Resonance Imaging (MRI) data of Fitch and Giedd (1999). The analysis shows that the non-uniformity is actually much larger that what would be required to explain the discrepancy from uniform scaling of format frequencies in the data of Peterson and Barney (1952). (2) There is also an oddity in the Peterson and Barney data; there are an excessive number of the formant frequencies which are integer multiples of the glottal-pulse rate of the vowel; that is, harmonics of the voice pitch. This suggests that the discrepancy might represent a measurement bias, arising from the well known problem of estimating formant frequencies from the harmonic spectra of voiced vowels. The problem is illustrated in the lower panel of Fig. 1. In this vowel token, there are harmonics (green vertical lines) below and above the centre of the first formant, but no harmonics at the formant frequency (which is the first peak of the spectral envelope). The problem is reviewed by de Cheveigné and Kawahara (1999) who conclude that it is inherent in spectrographic representations of speech sounds and extends to automatic transcription methods based on linear predictive coding (LPC). The purpose of the remainder of the paper is to develop a statistical model of vowel sounds that includes an inference technique to deal with the formant measurement problem. This new statistical approach to formant-frequency data has the distinct advantage that it can determine whether the inconsistent formant values observed in the data of Peterson and Barney (1952) are due to errors in formant-frequency estimation or to non-uniform growth of one, or more, components of the vocal tract, as suggested by Fant (1975). The result is surprising; once the measurement noise has been properly modelled, it is observed that the formant patterns of the vowel sounds do not vary systematically, either with the size or the sex of the speaker, despite the non-uniform growth of the anatomical cavities (oral and pharyngeal). Moreover, a Bayesian analysis of the fixed-formant-pattern hypothesis at the heart of the model indicates that more complex growth functions, with non-linear terms are less likely than the fixed pattern model, given the data of Peterson and Barney (1952). This means that the formant resonators are not affected by developmental changes in the oral-pharyngeal ratio, and that it is reasonable to assume that formant frequency values are effectively determined by vowel type and vocal tract length, independent of the position of the junction between the oral and pharyngeal cavities, as suggested by McGowan (2006). The results derived from the classic data of Peterson and Barney (1952) are confirmed by replicating the analyses on the massive developmental database reported by Lee et al. (1999). They recorded ten vowels from each of 436 children, ages 5-18, plus 56 adults. The final section (III) then shows how the statistical inference model can be used to estimate VTL from a separate set of developmental data reported by Huber et al. (1999), and how glottal pulse rate (GPR) and VTL evolve from age four to adulthood in the human population.
Evaluating the fixed-formant-pattern assumption with the data of Peterson and Barney (1952)
The classic formant data of Peterson and Barney (1952) were reanalyzed to quantify the proportions of inter-vowel and intra-vowel variability, and to assess the role of speaker size in the intra-vowel variability. Briefly, the analysis reveals that about 80% of the total variability in formant frequencies is accounted for by vowel type, and a second variable, acoustic scale (Cohen, 1993), that is closely related to VTL and speaker height, accounts for up to 90% of the remaining intra-vowel variability. This indicates the potential value of VTL normalization for speech recognition as noted by, for example, Welling and Ney (2004), and it supports the hypothesis that it should be possible to estimate VTL from vowel sounds.
Inter-vowel variability: vowel type
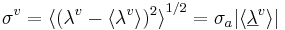
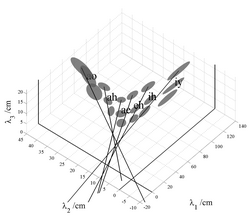
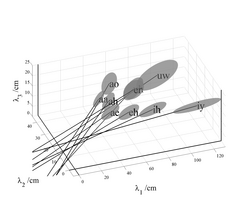
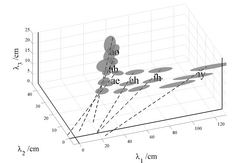
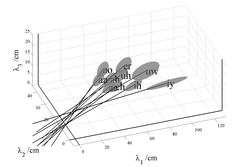
In their classic study, Peterson and Barney (1952) recorded two repetitions of 10 American vowels in hVd words (heed, hid, head, had, hod, hawed, hood, who'd, hud and heard) from 76 men, women and children. From the spectrogram of each recording, they estimated the frequencies of the first three formants (F1, F2, and F3) and the pitch of the vowel (F0). When the data were plotted in if F1-F2 space, the tokens of each vowel were found to cluster into relatively well defined regions that Peterson and Barney delimited with hand-drawn ellipses (their Fig. 8). In order to quantify the analysis, we have fitted three-dimensional Gaussian distributions to the F1-F2-F3 values of all of the tokens in each vowel cluster. The contours of constant probability associated with this distribution are ellipsoids; the contour associated with one standard deviation along each of the axes has been plotted for each of the 10 vowels in Fig. 2. The formant frequency values have been converted into their corresponding wavelengths (λ1, λ2, λ3) because the focus of this paper is VTL and the analysis is more direct when presented in terms of wavelengths. The positions of the ellipsoids in wavelength space reveal the established observations concerning inter-vowel variability: 1) There is virtually no overlap between the ellipsoids in this space. 2) The separation between the clusters is significantly greater in the λ1-λ2 plane than in the λ2-λ3 plane or the λ1-λ3 plane, indicating that the first two formants carry most of the vowel-type information. 3) The back vowels and front vowels occupy different planes in wavelength space due to the relatively high, and roughly constant, second formant of front vowels (Broad and Wakita, 1977). The analysis shows that inter-vowel variability accounts for about 80% of the total formant variability in the Peterson and Barney data.
Intra-vowel variability: vocal tract length
The intra-vowel variability is largely summarized by the eccentricity of the ellipsoid, its orientation, and its distance from the origin. With regard to eccentricity, in each case, one of the principal axes of the ellipsoid is much longer than the other two. This is basically because the vocal tract increases in length as a child grows up. The eccentricity can be quantified with the aid of a principal components analysis (PCA), and it shows that approximately 90% of the intra-vowel variability lies in the direction of the major axis of the ellipsoid. With regard to the orientation, the ellipsoids all point in the direction of the origin of the space, as illustrated by the lines in Fig. 2; they show the extension of the major axis of each ellipsoid in the direction of the origin (given by the major-eigenvector of the covariance matrix). Together the eccentricity and orientation of the ellipsoids indicate that, within each vowel cluster, the formant pattern is essentially fixed for all members of the population. This is the basis of formant ratio theory (e.g., Lloyd, 1890; Potter and Steinberg, 1950; and Miller, 1989) and the uniform scaling hypothesis (e.g., Fant, 1966). The principle has also been used to develop transforms that improve the performance of computer speech recognizers (Cohen, 1993; Irino and Patterson, 2002; Umesh et al., 2002; Welling and Ney, 2004). Similarly, it would appear that, if vowel type and VTL account for virtually all of the variability in the formant frequency data, then it would seem a relatively easy matter to estimate VTL given vowel type as outlined in the Introduction.
Mathematical formulation of the formant-pattern model
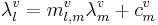
The mathematical form for the simplest version of the formant pattern model is
 (1)
(1)
where v is vowel type, i is the individual speaker, and  is a three-component vector of formant wavelengths that represents the formant pattern for vowel v of speaker i.
  is the vector representation of the average formant pattern for vowel v in the population. The scalar, ai , specifies the length of the individual’s vocal tract relative to the mean of the population. The fixed-formant-pattern model is very simple; there is a single parameter for each formant and a single value of ai that relates the individual’s formants to those of the population. It is the acoustic scale (Cohen, 1993) of the formants relative to that of the population.
Peterson and Barney (1952) were not able to measure the VTL of their speakers; indeed, it is very difficult (Fitch and Giedd, 1999). However, the prediction is that variability in VTL across a population of speakers causes systematic variability in the formant wavelengths of their vowels. Specifically, the fixed-formant-pattern hypothesis predicts that the vowel clusters are ellipsoids, and that the orientation of each vowel cluster is determined by the direction of the principal component of the variability. It also predicts that the major axis of the ellipsoid will pass through the origin and that the formant pattern is fixed along this line. The eccentricity is partly determined by the variability of VTL in the population, and partly be the distance of the ellipsoid from the origin of the space. In fact, the relative lengths of the ellipsoids along their major axes are predicted to depend entirely on their relative distances from the origin of the space according to
is the vector representation of the average formant pattern for vowel v in the population. The scalar, ai , specifies the length of the individual’s vocal tract relative to the mean of the population. The fixed-formant-pattern model is very simple; there is a single parameter for each formant and a single value of ai that relates the individual’s formants to those of the population. It is the acoustic scale (Cohen, 1993) of the formants relative to that of the population.
Peterson and Barney (1952) were not able to measure the VTL of their speakers; indeed, it is very difficult (Fitch and Giedd, 1999). However, the prediction is that variability in VTL across a population of speakers causes systematic variability in the formant wavelengths of their vowels. Specifically, the fixed-formant-pattern hypothesis predicts that the vowel clusters are ellipsoids, and that the orientation of each vowel cluster is determined by the direction of the principal component of the variability. It also predicts that the major axis of the ellipsoid will pass through the origin and that the formant pattern is fixed along this line. The eccentricity is partly determined by the variability of VTL in the population, and partly be the distance of the ellipsoid from the origin of the space. In fact, the relative lengths of the ellipsoids along their major axes are predicted to depend entirely on their relative distances from the origin of the space according to
 (2)
(2)
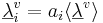
where σv is the magnitude of the principal component of the vowel cluster (which is equivalent to the length of the ellipsoid along the major axis), σa is the standard deviation of the VTL scalar in the population, and  is the magnitude of the vowel-cluster mean, or the distance from the origin of the space to the centre of the ellipsoid.
These two predictions can be used to confirm that VTL is the largest source of intra-vowel variability and to assess the accuracy of the fixed-formant-pattern hypothesis. The angle formed between the major axis of each ellipsoid and the line from the centre of that ellipsoid to the origin provides a measure of the accuracy of the hypothesis. The angles are presented in Table I for the ten vowels in the Peterson and Barney database along with the proportion of the intra-vowel variance accounted for by the principal component. The angles are very small and they show that VTL accounts for about 90% of the variability not attributable to vowel-type. Here, then, is a quantitative basis for FPT as observed in the classic data of Peterson and Barney (1952).
The result is surprising. It appears that the formant patterns of vowel sounds do not vary systematically, either with the size of the speaker or their sex. The analysis suggests that the anatomical distinction between the oral and pharyngeal divisions of the vocal tract is immaterial to the acoustic result of speech production. For a given vowel, the tongue constriction is simply positioned where it produces the appropriate ratio of front-cavity length to back-cavity length, independent of the location of the oral-pharyngeal junction. Evidence in support of this view was presented recently by McGowan (2006); he used a five-tube model of the vocal tract to reanalyse the vowel sounds produced by young children imitating the vowels of adults and found that they produce similar formant ratios. The modelling led him to conclude that in order to produce the appropriate formant ratios, the rear tube of the child often includes the uvula (which Fitch and Giedd use to mark the junction between the oral and pharyngeal cavities) whereas the rear tube of the adult male is wholly contained in the pharynx below the uvula.
is the magnitude of the vowel-cluster mean, or the distance from the origin of the space to the centre of the ellipsoid.
These two predictions can be used to confirm that VTL is the largest source of intra-vowel variability and to assess the accuracy of the fixed-formant-pattern hypothesis. The angle formed between the major axis of each ellipsoid and the line from the centre of that ellipsoid to the origin provides a measure of the accuracy of the hypothesis. The angles are presented in Table I for the ten vowels in the Peterson and Barney database along with the proportion of the intra-vowel variance accounted for by the principal component. The angles are very small and they show that VTL accounts for about 90% of the variability not attributable to vowel-type. Here, then, is a quantitative basis for FPT as observed in the classic data of Peterson and Barney (1952).
The result is surprising. It appears that the formant patterns of vowel sounds do not vary systematically, either with the size of the speaker or their sex. The analysis suggests that the anatomical distinction between the oral and pharyngeal divisions of the vocal tract is immaterial to the acoustic result of speech production. For a given vowel, the tongue constriction is simply positioned where it produces the appropriate ratio of front-cavity length to back-cavity length, independent of the location of the oral-pharyngeal junction. Evidence in support of this view was presented recently by McGowan (2006); he used a five-tube model of the vocal tract to reanalyse the vowel sounds produced by young children imitating the vowels of adults and found that they produce similar formant ratios. The modelling led him to conclude that in order to produce the appropriate formant ratios, the rear tube of the child often includes the uvula (which Fitch and Giedd use to mark the junction between the oral and pharyngeal cavities) whereas the rear tube of the adult male is wholly contained in the pharynx below the uvula.
Residual variability
Although the analysis of formant variability indicates that FPT is largely correct, a detailed examination of Fig. 2 shows that when the main axes of the ellipsoids are extended toward the origin, they actually intercept the λ1=0 plane at points where λ2 and λ3 are slightly, but consistently positive, and they intersect the λ3=0 plane at points where the values of λ1 are consistently negative. This consistent bias in the intercepts leads to the hypothesis that there might be one more factor making a small, but consistent, contribution to formant frequency variability. A clue to the form of the remaining variability is provided in Fig. 3 which shows the sub-clusters for men, women and children plotted separately for six of the vowels in Fig. 2; the centroids of the sub-clusters for men, women and children are relatively widely separated on the uniform scaling lines. This means that VTL variability is greater between speaker groups than within speaker groups – an observation that has recently been confirmed by Gonzalez (2004). Moreover, the principal axes of the sub-clusters with the more extreme values of λ1 are more closely aligned with the first-formant axis than the fixed formant pattern line; the most obvious examples are the vowels /iy/ and /ih/. This suggests that within speaker sub-clusters, there may be another consistent source of variability which is only revealed in conditions where VTL variability is small.
There are several candidates for the source of this effect: Fant (1966; 1975) suggested that variability in the formant pattern across speakers arises, at least in part, because the pharynx is proportionately larger in men than in women and children. He proposed a non-uniform scaling procedure with separate scale factors for each formant of each vowel, to represent the non-uniform growth of the different components of the vocal tract. The MRI data of Fitch and Giedd (1999) (reanalyzed below) confirm that the pharynx is proportionately larger in men, but this does not immediately indicate how the scale factors would be affected by VTL. Subsequently, Umesh et al. (2002) showed that Fant’s scale factors could be averaged across vowels to form a single non-uniform scaling function that describes the scale factor as a function of formant frequency. In both cases, the implication is that there is one main, latent variable in this system which is the acoustic scale of the vowel, but that this variable affects different formants in different ways, necessitating extra parameters to be added to the fixed pattern model. In the next Section, we develop a statistical model of formant frequency data that can accommodate more complicated growth dependencies, should they be required, and which has the power to reveal any remaining sources of variability beyond those accounted for by vowel type and the fixed pattern hypothesis. In the event, however, what appears as an ‘effect’ is revealed to be a bias caused by well known problems in formant frequency estimation (e.g., de Cheveigné and Kawahara, 1999).
The form of the non-uniform growth of the oral and pharyngeal cavities
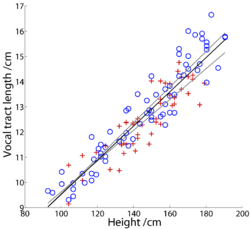
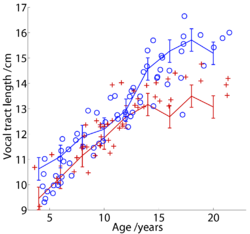
Fitch and Giedd (1999) used Magnetic Resonance Imaging (MRI) to examine the growth of the components of the vocal tract as children mature into adults. The study included 129 men, women and children ranging in age from 2.8 to 25 years. They recorded each subject’s age, height and weight, but they did not record samples of their speech sounds. The measurements were made with the subjects in the nasal breathing posture, and care was taken to exclude those who were overweight or whose families had a history of language or developmental problems. Figure 4 shows VTL as a function of height for all of the males (o) and all of the females (+) separately; VTL is essentially a linear function of height in both cases. There are proportionately more men at the tallest heights, but the two populations fall along lines with very similar slopes. It is also the case that the vocal tract grows proportionately slower than height, because the head is proportionately larger than the body in children, but the proportionality is the same for the two groups. The growth rate is 0.067 cm /cm.
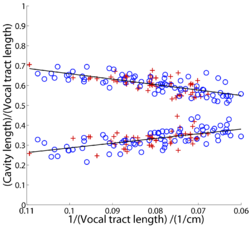
Figure 5 shows the relative lengths of the oral and pharyngeal portions of the vocal tract as a function of VTL, separately for males (o) and females (+). The figure shows that the length of the oral cavity decreases, and the length of the pharyngeal cavity increases, relative to VTL, as VTL increases. This is because the size of the oral cavity is largely determined by the size of the head which decreases as a proportion of body height as a person grows up. The figure makes it clear that the growth of the oral and pharyngeal cavities is decidedly non-uniform. Note, however, that the changes are linear in these coordinates and, for a given VTL, there is no difference between males and females in terms of the proportions of the cavities. This suggests that models which relate vocal tract growth to formant frequencies need not be excessively complex. It is the pronounced non-uniform growth of the oral and pharyngeal cavities that prompts us to avoid the phrase ‘uniform scaling’ when describing formant frequency variability, and to adopt, instead, the phrase ‘fixed formant pattern’. The phrase ‘uniform scaling’ is too readily misinterpreted as implying that the consistency of the formant pattern is the result of uniform growth of the anatomical components of the vocal tract, which is clearly incorrect in the case of the oral and pharyngeal cavities.
A statistical version of the formant pattern model
The fact that the growth functions for the oral and pharyngeal cavities are linear suggests that it might be fairly simple to extend the fixed-formant-pattern hypothesis to explain the uniform scaling of formant frequencies observed in the data from the non-uniform growth of the oral and pharyngeal cavities, in much the same way as proposed by Fant (1966; 1975). In this case, however, statistical methods are used to learn the relationship between formant frequency and acoustic scale from the data. There is one further complication associated with the problem of formant frequency estimation, which is solved by treating the acoustic scale of the vowel as a ‘latent variable’ which is inferred from the data
Modelling vocal tract length
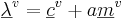
As a child matures and their height increases, so does the length of their vocal tract and, thus, the acoustic scale of their speech sounds. Height, VTL, and acoustic scale also depend on the sex of the speaker beyond about age 12, when VTL and acoustic scale become somewhat greater in males relative to their height. The model developed in this section contains a latent, or hidden, variable – a general growth factor that will be instantiated as VTL and designated, L, since that is the form of the variable that is most familiar. VTL is directly related to acoustic scale (Cohen, 1993), which is assumed to be multi-modal in the population with clusters corresponding to men, women and children. More specifically, it is assumed that the lengths of the various cavities and components of the vocal tract are linearly related to VTL via the average length of the cavity, or component, and a weighting factor, which can be thought of as reflecting the growth rate of the cavity or component (see Eq. 3 below). For cavities like the pharynx, whose proportion changes with growth, the dependence is strong and the weighting factor is large. For components like the lips, whose proportion changes little with growth, the dependence is weak and the weighting factor is small. The weighting factors enable us to construct a model of the vocal tract in terms of VTL, where the growth of the components of the vocal tract is non-uniform but, nevertheless, a linear function of height. Mathematically, the model is
 (3)
(3)
where  is the average length for cavity c for people articulating the vowel v, and a is the relative VTL of the individual.
  is a constant that does not depend on the individual.
This relationship is consistent with the analysis of vocal tract component lengths presented by Fitch and Giedd (1999). If the total length of the vocal tract is written as the sum of the component lengths, as follows,
is a constant that does not depend on the individual.
This relationship is consistent with the analysis of vocal tract component lengths presented by Fitch and Giedd (1999). If the total length of the vocal tract is written as the sum of the component lengths, as follows,
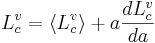
![{L^v} = \sum_c{L^v_c} = \sum_c \left[\langle{L^v_c}\rangle + a\frac{d L^v_c}{da}\right] = \langle{L^v}\rangle + a\frac{d L^v}{da}](../images/math/d/c/3/dc3b760810e7f24c558bd5c1dd1e8629.png) (4)
(4)
this expression can be substituted back into Eq. 3 to eliminate the unknown acoustic scale variable, a, and produce an expression for the ratio of a cavity or component’s length, Lc, to the total length of the vocal tract, L.
![\frac{L^v_c}{L^v} = \left[\langle{L^v_c}\rangle - \langle{L^v}\rangle\frac{dL^v_a}{dL^v}\right]\frac{1}{L^v} + \frac{dL^v_c}{dL^v}](../images/math/7/d/f/7dfe3f24a9e6e86fb3c5112b00ed551a.png) (5)
(5)
Thus, in this model of vowel production, the growth of the individual cavities and components is predicted to be linear when plotted against the reciprocal of L, which is precisely what was observed in Fig. 3. There is variability in the data that the model does not absorb, but there does not appear to be any consistent deviation as a function of speaker height of the sort that would warrant including quadratic, or higher-order, terms in the model. It is now possible to determine quantitatively whether higher order terms are warranted, by fitting Nth-order polynomials to the data, and learning maximum-likelihood parameters for the terms and corresponding error-bars on these inferences. The linear model can then be compared to models of higher order, weighting the best-fit likelihoods of the more complicated models by penalty factors known as Occam factors, which depend both on prior knowledge and the error bars on the maximum-likelihood parameter estimates. In Bayesian statistics, this is a non-arbitrary form of hypothesis test (Mackay, 2003). In the current case, the linear model is found to be much more probable than models with higher-order terms. Indeed, the linear terms in the higher order approximations were found to have similar values to those of the linear model, and the higher terms were found to contribute little within the range of the data. This, then, is a quantitative justification for using the non-uniform, but linear, model of VTL variability, and it can now be used to deconvolve the effect of vocal tract changes on vowel formant frequencies.
The formant pattern model and the non-uniform growth of the oral and pharyngeal cavities of the vocal tract
The next step is to relate VTL to formant wavelength. Broadly speaking, the higher formants in Peterson and Barney’s (1952) data, F2 and F3, are well modelled as simple standing wave resonances, so they will have wavelengths which are linearly dependent on the length of the vocal tract for a given vowel and formant. A simple standing wave is not, however, a good model of the first formant. To wit, the wavelength of the first formant can be as much as eight times the length of the vocal tract, which is twice the maximum length that would be expected for a simple standing wave resonance. Fant (1966) has argued that the first formant is commonly a Helmholtz resonance, in which case, the relationship between the frequency of the first formant and the growth of the vocal tract might be expected to be more complicated. In the event, however, when the correlations between formants for all of the vowels were analysed (using the Bayesian techniques described in the previous section) the relationships were found to be well approximated by a linear relationship. As a consequence, any pair of formants in a vowel is linearly related; that is,
 (6)
(6)
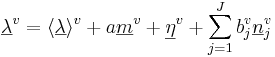
where l and m are formant numbers, 1, 2 or 3. This means that a fairly simple model might be expected to capture the majority of the variability in Peterson and Barney’s data, so long as it incorporates the model of vocal tract growth derived earlier in Section II.A. A straightforward approach, consistent with the data, is to describe each resonator in terms of an effective wavelength that is a simple linear function of VTL, regardless of its physical complexity. That is,  . Each of the effective wavelengths might be expected to develop in exactly the same way as the physical dimensions of the vocal tract (Eq. 3), in which case the predicted relationship between formant wavelengths is linear, as observed previously in this section. This description can be generalized to the three component vowel-vectors
 where
where 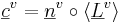 and
and 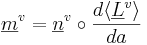 (7)
(7)
(where  denotes the element-wise product). The prediction of this model is that the vowel clusters will form on segments of lines oriented in the direction
  with centroids at
  . If the growth rate of the effective lengths is uniform, then and are parallel and the fixed-formant-pattern model is recovered as a simple limit. If the distribution of the acoustic scale factor, a, is Gaussian then this model is equivalent to PCA and the analysis of Section I.A is recovered. However, as noted earlier, the distribution is not Gaussian; there are three distinct classes of speaker (men, women and children). Therefore a more sensible choice is a mixture of Gaussians, with a Gaussian component for each group.
Two versions of the statistical model were developed – distinguished by their assumptions concerning the source of the vowels in each vowel cluster. In the first, and simpler, version, the vowels in each cluster were treated as if they all came from different speakers, and thus the clusters can be fitted individually. In point of fact the vowels in the clusters are not independent with respect to VTL; each speaker contributes two tokens to each of the ten vowel clusters. The second version of the model incorporates this constraint, which, in turn, makes it possible to fit all the vowel clusters simultaneously. Although the inferred acoustic scale factors estimated with the second version of the statistical formant pattern model are almost certainly more accurate, the parameter values derived from the two models are very similar. Accordingly the discussion is restricted to the results from the second version of the model, and it is these values that are reported in Table I.
. If the growth rate of the effective lengths is uniform, then and are parallel and the fixed-formant-pattern model is recovered as a simple limit. If the distribution of the acoustic scale factor, a, is Gaussian then this model is equivalent to PCA and the analysis of Section I.A is recovered. However, as noted earlier, the distribution is not Gaussian; there are three distinct classes of speaker (men, women and children). Therefore a more sensible choice is a mixture of Gaussians, with a Gaussian component for each group.
Two versions of the statistical model were developed – distinguished by their assumptions concerning the source of the vowels in each vowel cluster. In the first, and simpler, version, the vowels in each cluster were treated as if they all came from different speakers, and thus the clusters can be fitted individually. In point of fact the vowels in the clusters are not independent with respect to VTL; each speaker contributes two tokens to each of the ten vowel clusters. The second version of the model incorporates this constraint, which, in turn, makes it possible to fit all the vowel clusters simultaneously. Although the inferred acoustic scale factors estimated with the second version of the statistical formant pattern model are almost certainly more accurate, the parameter values derived from the two models are very similar. Accordingly the discussion is restricted to the results from the second version of the model, and it is these values that are reported in Table I.
The variability of formant measurements
Having included the effects of vowel type and VTL in the statistical version of the formant pattern model, the question is whether the formant frequency data contain other consistent sources of variability, or whether the remaining variability is just due to measurement noise. In this latent variable model, it is necessary to put in an explicit term for the residual noise. When this model, with its noise term, is applied to the data, the result is surprising; most of the remaining variability in the formant wavelength data is due to a consistent measurement error, and when the error is properly modelled, the fixed-formant-pattern model is observed to absorb most of the remaining variability. This indicates that, if there is another natural factor, then its effect is limited to a very small contribution – a contribution that would be difficult to characterize because its effect is obscured by measurement noise.
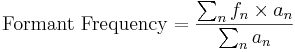
The measurement error arises from the fact that it is difficult to estimate formant frequency values from a spectrogram, particularly for the first formant, as noted in the Introduction and illustrated in Fig. 1. Linear Predictive Coding (LPC) based methods are also error prone in this situation and only guarantee accuracy of approximately a quarter of the glottal pulse rate (Monsen and Engebretson, 1983; Vallabha and Tuller, 2002). Peterson and Barney’s method was less sophisticated; they used a simple weighted average of the harmonics, fn, in the neighbourhood of the formant (see Potter & Steinberg, 1950),
 (8)
(8)
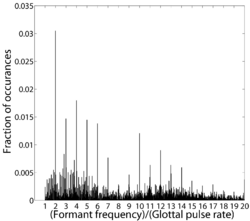
Statistically, their method has similar restrictions to those of LPC with respect to accuracy, but the observed errors are somewhat larger; moreover, an analysis of the data shows that a curiously high proportion of the formant estimates (~ 20%) are integer multiples of the GPR as shown in Fig. 6. It appears that the estimate of formant frequency is attracted by a nearby harmonic frequency, which it would only rarely be by chance. It is also clear that many of the formant frequency estimates were based on a single harmonic frequency. It turns out that this consistent measurement error is the source of much of the remaining variability in the vowel formant data. The measurement noise is roughly the same in absolute terms for all of the formants and so, as a proportion, the effect is largest for the first formant and smallest for the third formant. In wavelength terms,
 (9)
(9)

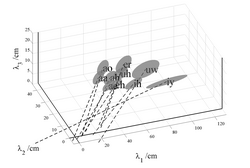
The distortion that the measurement error imparts to the vowel clusters is illustrated in Figs. 7a and 8a, which show views of the respective spaces presented in Figs 2 and 3, but with the view rotated to emphasize the λ1- λ3 plane, and thereby, to emphasize the variability in λ1. In Fig. 8a, for vowels having a large λ1, such as /iy/ and /ih/, the individual ellipsoids for men, women and children are observed to be highly elongated in the λ1 direction. The elongation is a very unusual form of variability, and it is not clear how factors like the non-linear growth of the oral-pharyngeal ratio could explain this form of variability since it does not vary with speaker size. The form of the variability led to the hypothesis that, the lack of an explicit noise term in the deterministic formant pattern model (Section I.A), leads to a bias in the formant wavelength estimates that produces the elongation of the ellipsoids in Fig. 8a, and the twisting of the angles of the main axes of the composite ellipsoids in Figs 2 and 7a, which then causes the intercepts of the axes to shift away from the origin. The effect of the bias is illustrated schematically in Fig. 9. The statistical, formant-pattern (SFP) model avoids the bias by introducing explicit terms for the noise associated with each formant,
 (10)
(10)
where  is the formant-specific noise term. It is a vector of zero mean Gaussian noise with covariance given by
 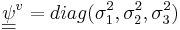 . A factor,
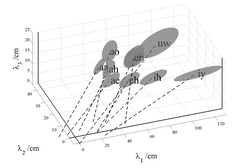
  , was also added to capture any other consistent source of natural variability in the data. This allowed us to assess the relative contribution from an extra, natural factor, on the one hand, and measurement noise, on the other hand. This comparison revealed that, in effect, there were no other natural factors. The result is illustrated in Figs 7b and 8b by the dashed lines which go through the centroids of the ellipses and which point more accurately toward the origin of the space. The average bias is considerably reduced in this stochastic model of formant wavelength.
In more recent developmental studies of formant frequency, such as those of Hillenbrand et al. (1995) and Lee et al. (1999), the formant frequency values were estimated automatically from spectral frames of vowel sounds using linear predictive coding (LPC). The deterministic and statistical versions of the formant pattern model were fitted to the data of both Hillenbrand et al. and Lee et al. to determine (a) whether the extended axes of the vowel ellipsoids would still show the bias away from the origin when the deterministic version of the model was fitted to the LPC data, and (b) whether the bias would be reduced when the statistical version was fitted to the data. The results for the data of Lee et al. (1999) are presented in Fig. 10 in the same format as shown for the data of Peterson and Barney in Figs 7 and 8. The database of Lee et al. is far larger than that of Hillenbrand et al. and it covers a much greater range of ages. Lee et al. recorded ten vowels spoken by 436 children, ages 5-18, and 56 adults. Figure 10a shows the location of the ellipsoids for each vowel in wavelength space. The distribution of the ellipsoids is very similar to that shown for the Peterson and Barney data in Fig. 7a, and the extensions of the major axes show the same bias away from the origin. There is also the same pronounced elongation of the ellipsoid for the vowel /iy/ in the λ1 direction, probably due to the problem of estimating λ1 which is particularly long in this vowel. The results for the SFP model are presented in Fig. 10b, where the main axes of the ellipsoids are observed to intercept the λ1-λ3 plane at points much closer to the origin, indicating that the average bias is considerably reduced for this version of the formant pattern model. Similar results were obtained with the data of Hillenbrand et al. (1995) indicating that the LPC method of extracting formant frequencies has a similar problem to that observed with the spectrogram reading method, as would be expected. The analysis of Hillenbrand et al. data is omitted for brevity. The statistical analysis of formant wavelengths presented above is a modified version of Factor-Analysis (FA) (Roweis and Ghahramani, 1999), where the distribution over the latent variable, p(a), is a mixture of Gaussians rather than a single Gaussian. The mixture of Gaussians was used to represent p(b) as well, but in this case the divergence from a simple Gaussian was minimal. The formant measurement error produces a particular problem for deterministic versions of formant ratio theory (e.g., Miller, 1989), inasmuch as ratios accentuate variability. Moreover, it is traditional to use ratios that have F1 in the denominator, and F1 is the formant estimate that is most prone to error, so the accentuation of the variability is particularly large in the traditional version of formant ratio theory. The variability introduced by the measurement error, and the accentuation of the variability associated with the use of ratios, is likely to have hampered efforts to normalize for acoustic scale using formant ratios. In the statistical analysis of formant-frequency data, the vectors of formant frequencies are treated as a stochastic pattern; that is, the three formants are fitted simultaneously as a mixture of Gaussians, without the calculation of ratios. The shift in emphasis is important and this is why the model is referred to as a statistical, formant-pattern (SFP) model, rather than formant ratio theory. The phrase ‘formant pattern’ is intended to emphasize that the vector of formant wavelengths is a representation of the spectral envelope of the vowel. The shape and position of the spectral envelope are best estimated using a vector of formant peaks which are statistically defined, which is why the acronym for the model includes the ‘S.’ To reiterate, deterministic formant ratios provide a rather unreliable measure of the spectral envelope of a vowel because they amplify the error of the formant in the denominator and, unfortunately, it is common practice to use the most error prone of the formants, the first, as the denominator.
Estimatimg VTL from formant-frequency data
Huber et al. (1999) have reported a developmental study of vowel production using tokens of /a/ recorded from 160 children and adolescents aged 4 to 18, and 20 young adults. Three examples of the vowel were recorded at each of three sound levels for each speaker. Huber et al. (1999) report the average values for the first three formants in /a/, separately, for groups of ten males and ten females in each of nine age bins (4, 6, 8, 10, 12, 14, 16, 18, and adults); they also provide glottal-pulse rate (GPR) values for the vowels. In this section, the SFP model is extended to produce an algorithm for estimating VTL, and it is illustrated with the data of Huber et al. (1999). Finally, the results are used to characterize the complex locus of vocal tract development in the VTL-GPR plane.
Learning the parameter values of the SFP model
In order to infer the acoustic scale factor of an unknown speaker from their formant data, the values of the model’s parameters must be learned from the data, namely, the statistics of (i) the relative vocal tract lengths [p(a)], (ii) the noise [ ], and (iii) the factor loadings [
 ]. The learning and inference is accomplished using Bayesian methods, in particular, the variational Expectation-Maximisation algorithm of Ghahramani and Hinton (1996). This algorithm repeatedly optimizes a lower bound on the likelihood in two steps: in the Expectation (E) step, the algorithm infers the acoustic scales of the speakers, given the current parameter estimates; in the Maximization (M) step it finds the most likely parameters given the inferred acoustic scales. The iteration of the two steps typically converges in the region of the maximum-likelihood estimate for the parameters (Ghahramani and Hinton, 1996).
The algorithm is free to find several components of variability that can point in any direction; the striking result is that for each vowel there is one component that absorbs most of the variability (see Table I), and that the component invariably points towards the origin of the space as would be predicted by the SFP model. The orientation of each component derived with the model is compared to the orientation of the corresponding component derived from the deterministic version of the model. The results are presented in the lower row of Table I; they show that, if measurement noise and other sources of natural variability are modelled statistically, the component of variability attributable to VTL becomes more uniform, while the residual noise decreases correspondingly. Moreover, the SFP model learns that the average measurement error is 50 Hz which is consistent with the inherent inaccuracy in the formant extraction process described in Section II.C.
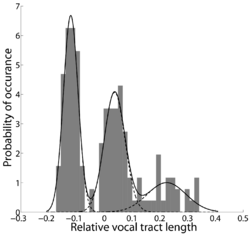
In Section II.B, it was assumed that the population of acoustic scales represented by the data in the Peterson and Barney study is actually comprised of three sub-populations (men, women, and children) each of which is Gaussian. The distribution of inferred acoustic scales is presented in Fig. 11, together with the fitted mixture of Gaussians. The distribution is clearly tri-modal, justifying the assumptions of the model.
]. The learning and inference is accomplished using Bayesian methods, in particular, the variational Expectation-Maximisation algorithm of Ghahramani and Hinton (1996). This algorithm repeatedly optimizes a lower bound on the likelihood in two steps: in the Expectation (E) step, the algorithm infers the acoustic scales of the speakers, given the current parameter estimates; in the Maximization (M) step it finds the most likely parameters given the inferred acoustic scales. The iteration of the two steps typically converges in the region of the maximum-likelihood estimate for the parameters (Ghahramani and Hinton, 1996).
The algorithm is free to find several components of variability that can point in any direction; the striking result is that for each vowel there is one component that absorbs most of the variability (see Table I), and that the component invariably points towards the origin of the space as would be predicted by the SFP model. The orientation of each component derived with the model is compared to the orientation of the corresponding component derived from the deterministic version of the model. The results are presented in the lower row of Table I; they show that, if measurement noise and other sources of natural variability are modelled statistically, the component of variability attributable to VTL becomes more uniform, while the residual noise decreases correspondingly. Moreover, the SFP model learns that the average measurement error is 50 Hz which is consistent with the inherent inaccuracy in the formant extraction process described in Section II.C.
In Section II.B, it was assumed that the population of acoustic scales represented by the data in the Peterson and Barney study is actually comprised of three sub-populations (men, women, and children) each of which is Gaussian. The distribution of inferred acoustic scales is presented in Fig. 11, together with the fitted mixture of Gaussians. The distribution is clearly tri-modal, justifying the assumptions of the model.
Inferring a speaker’s acoustic scale
The main issue in the VTL estimation algorithm, as in the vowel production model, is to identify and correctly characterize the different components of the variability in the formant frequency measurements. It is assumed that the measurement noise for individual vowel samples in the Huber et al. (1999) data has approximately the same form as that of the Peterson and Barney (1952) data. Huber et al. (1999) used an automated LPC process to extract their formant frequency data, which means that the errors should be similar in form to those in the Lee et al. (1999) data. The absolute size of the errors will be somewhat smaller with the LPC procedure than for the manual, spectrogram-based procedure of Peterson and Barney (1952), but, in principle, the noise sources can be scaled down by a constant factor to represent the greater precision of LPC analysis. Finally the articulation of the vowel must be assumed to be the same in the two studies. These assumptions can be verified retrospectively. The methods developed in the previous section can now be used to infer the relative VTL of Huber et al.’s speakers from their formant frequency data.
Calibration of the Huber et al. data to the VTLs of Fitch and Giedd
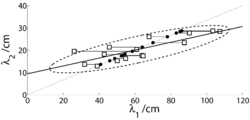
When the VTL estimation procedure is applied to the data of Huber et al. (1999), it provides estimates of the relative VTL, a, for each group of speakers in each age category. In order for these estimates to be converted into absolute VTLs, we assume that the studies of Huber et al. and Fitch and Giedd were sampling from the same distribution of people, which was modelled as a mixture of Gaussians earlier. In this case, the relative VTLs from the study of Huber et al. can be scaled using the mean and variance data from Fitch and Giedd. The VTLs inferred from Huber’s study, and the lengths measured by Fitch and Giedd are presented together in Fig. 12. The correspondence is surprisingly good, particularly for the male speakers. The male values from the Huber et al. study seem a little high at four and six years, and the female values seem a little low for age 16 and above, but the deviations are not large relative to the overall variability.
The GPR-VTL plane: development and natural variability
Finally, the data from Peterson and Barney (1952) and Huber et al. (1999) were combined to characterize the developmental trajectory of vowel sounds in the logGPR-logVTL plane. The domains occupied by men, women, and children in the plane were delineated using the Peterson and Barney (1952) data. The 20 vowel sounds produced by each speaker (two tokens of each of ten vowels) were used to produce an estimate of each speaker’s VTL (using the EM algorithm and the procedure described in Section II.D); when combined with the corresponding GPR estimates, each individual provides 20 GPR-VTL points on the GPR-VTL plane. Two-dimensional Gaussian distributions were fitted separately to the data of the men, women and children to characterize the domain of each speaker class on the GPR-VTL plane.
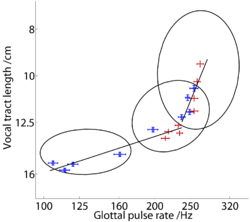
Contours of constant probability in these distributions are elliptical in form, and the contours that enclose 90% of the individuals in each speaker class are shown by the three ellipses in Fig. 13. Unfortunately, the record of the Peterson and Barney data currently available does not contain information regarding the ages of individual children or their heights, and so the VTL estimates of the children had to be calibrated using the values for the adult males; specifically, the mean and variance for the VTL estimates of the adult males (derived from the Peterson and Barney data) were equated to the mean and variance of the VTL values for the adult males reported by Fitch and Giedd. The mean VTL value inferred for each age-by-sex group in the Huber et al. (1999) data was paired with the appropriate mean GPR value and plotted in the GPR-VTL plane (Fig. 13) to show the developmental trajectory of the voice for males and females as they mature. The symbols include ± one standard deviation in both dimensions. Within each ellipse, the trajectory from the Huber et al. data reflects the eccentricity of the ellipse derived from the Peterson and Barney (1952) data. There is good agreement between the developmental data and the positions of the ellipses. It appears that the growth trajectories can be summarized with a pair of straight lines that meet near the centre of the ellipse for women. The segment with the steeper slope was fitted to the data of males and females from age 4 to 10; it has a slope of 1.9. The segment with the shallower slope was fitted to the data of males and females from age 12 upwards; it has a slope of 0.25. With regard to practical application of the VTL estimation process, it is theoretically possible to estimate VTL from all vowels and sonorant consonants on a frame by frame basis, when the vowel type is known. However, VTL would be expected to change at a much slower rate than formant frequency since it mainly changes with the speaker. So a reasonable strategy would probably be to limit VTL estimation to strong vowels where the recognizer is confident of the vowel type.
Summary and conclusions
A Principal Components Analysis was used to cluster the classical formant-frequency data of Peterson and Barney (1952) and provide ellipsoids showing the distribution of formant frequencies associated with each vowel and population subgroup. The analysis revealed that vowel type accounts for 90% of the variability in formant frequencies, and 80% of the remaining variability is accounted for by VTL. Sufficient variability remained to support the hypothesis that there might be another consistent source of variability, such as developmental changes in oral-pharyngeal ratio. The MRI data of Fitch and Giedd (1999) were reanalysed to evaluate this hypothesis, and the analysis confirmed that the growth of the oral and pharyngeal cavities is non-uniform, with the pharyngeal cavity growing faster than the oral cavity. However, the growth functions are linear. What is more, the growth functions for men, women and children are all the same. Despite the non-uniform growth of the anatomical cavities of the vocal tract, there is no commensurate non-linearity in the formant pattern data; indeed, the formant pattern is essentially fixed for a given vowel, shifting towards the origin without changing shape as VTL increases. This means that the systematic variability in formant frequency data (at least the first three formants) is effectively divided between vowel type and VTL, and it suggests that speakers adjust the shape of the vocal tract as they grow to maintain a specific pattern of formant frequencies for each vowel type, independent of the relative sizes of oral and pharyngeal cavities. The conclusion is important because it means that it should be a straightforward matter to estimate VTL from the voiced sounds in continuous speech. A statistical formant pattern (SFP) model of formant frequency data was developed with (a) a latent variable to absorb the variability of all size related factors, (b) non-uniform, but linear, growth functions for the oral and pharyngeal cavities, and (c) separate measurement-noise terms for each of the formants. A modified version of factor analysis was developed to infer the acoustic scale factor of the vowels and, thus, the VTL of an unknown speaker, from the formant data of a given vowel type. The use of statistical methods to model the measurement noise revealed that the vast majority of the variability not attributable to vowel type is associated with VTL, and if there are any other natural sources of systematic variability their contribution is small with respect to the error in formant frequency estimation. The statistical version of the formant pattern model was used to correct the biases of the deterministic version of the model, and the effect of the correction was illustrated with the formant frequency data of both Peterson and Barney (1952) and Lee et al. (1999). Finally, the SFP model was used to analyze the developmental data of Huber et al (1999). The mean VTL was estimated for each age group, and the results were used to chart the development of VTL and GPR in children as they mature into adults.
Acknowledgements
We would like to thank Dr T. Fitch for kindly providing the individual data on the lengths of the parts of the vocal tract from their MRI data. The first author was supported by the Gatsby Charitable Foundation through the writing of this paper. The research was supported by the UK Medical Research Council (G0500221; G9900369) and by the Air Force Office of Scientific Research, Air Force Material Command, USAF, under grant number FA8655-05-1-3043. The U.S. Government is authorized to reproduce and distribute reprints for Government purpose notwithstanding any copyright notation thereon. The views and conclusions contained herein are those of the author and should not be interpreted as necessarily representing the official policies or endorsements, either expressed or implied, of the Air Force Office of Scientific Research or the U.S. Government.
References
Broad, D.J. and Wakita, H. (1977). “Piecewise-planar Representation of Vowel Formant Frequencies”, Journal of the Acoustical Society of America 62, 1467–1473.
de Cheveigné, A. and Kawahara, H. (1999). “Missing-data model of vowel identification,” Journal of the Acoustical Society of America 105(6), 3497-3508.
Cohen, L. (1993). “The scale transform,” IEEE Trans. Acoust. Speech and Signal Processing, 41, 3275-3292.
Fant, G. (1966). “A note on vocal tract size factors and non-uniform F-pattern scalings,” Speech Transmission Laboratory, Royal Institute of Technology, Stockholm QPSR 4, 22-30.
Fant, G. (1975). "Non-Uniform Vowel Normalization," Speech Transmission Laboratory, Royal Institute of Technology, Stockholm QPSR 2-3, 1-19.
Fitch, W. T., and Giedd, J. (1999). “Morphology and development of the human vocal tract: A study using magnetic resonance imaging,” J. Acoust. Soc. Am. 106, 1511-1522.
Ghahramani, Z. and Hinton, G.E. (1996). “The EM Algorithm for Mixtures of Factor Analyzers,” University of Toronto Technical Report CRG-TR-96-1 (http://www.gatsby.ucl.ac.uk/~zoubin/papers.html, last viewed 22 January 2008)
González, J. (2004). “Formant frequencies and body size of speaker: a weak relationship in adult humans,” J. Phonetics 32, 277-287.
Hillenbrand et al (1995)
Huber, J. E., Stathopoulos, E. T., Curione, G. M., Ash, T. A. and Johnson, K. (1999). “Formants of children, women, and men: The effects of vocal intensity variation,” J. Acoust. Soc. Am. 106(3), 1532-1542.
Irino, T., and Patterson, R. D. (2002). “Segregating information about the size and shape of the vocal tract using a time-domain auditory model: The stabilized wavelet-Mellin transform,” Speech Commun. 36, 181-203.
Lloyd, R. J. (1890). “Speech sounds: Their nature and causation (I),” Phoneticia Studien 3, 251-278.
Mackay, D. J. (2003). Information Theory, Inference and Learning Algorithms, (Cambridge University Press, Cambridge, UK).
Miller, J. D. (1989). “Auditory-perceptual interpretation of the vowel,” Journal of the Acoustical Society of America, 85, 2114-2133.
McGowan, R. S. (2006). “Perception of synthetic vowel exemplars of 4 year old children and estimation of their corresponding vocal tract shapes,” Journal of the Acoustical Society of America 129(5), 2850-2858.
Monsen, R. B. and Engebretson, A. M. (1983). “The accuracy of formant frequency measurements: a comparison of spectrographic analysis and linear prediction,” J. Speech Hear. Res. 36, 89-97.
(Patterson, van Dinther and Irino, 2007)
Peterson, G. E. (1961). “Parameters of vowel quality,” J. Speech Hear. Res. 4, 10-29.
Peterson, G. E. and Barney, H. I. (1952). “Control methods used in the study of vowels”, Journal of the Acoustical Society of America, 24, 75-184.
Potter, R. K. and Steinberg, J. C. (1950). “Toward the Specification of Speech”, Journal of the Acoustical Society of America, 22, 807-820.
Roweis, S. and Ghahramani, Z. (1999). “A Unifying Review of Linear Gaussian Models,” Neural Computation, 11(2), 305-345.
Umesh, S., Bharath Kumar, S. V., Vinay, M. K., Sharma, R., and Sinha, R. (2002). “A simple approach to non-uniform vowel normalization,” ICASSP, Orlando, Florida.
Vallabha, G. K. and Tuller, B. (2002). “Systematic errors in the formant analysis of steady-state vowels,” Speech Commun. 38, 141-160.
Welling, M. and Ney H. (2004). “Speaker adaptive modeling by vocal tract normalization,” IEEE Trans. Speech Audio Process. 10. 415-426