The robustness of bio-acoustic communication and the role of normalization
From CNBH Acoustic Scale Wiki
|

The sounds that mammals use to communicate, including the syllables of speech, have a very special `pulse resonance' form which makes them very distinctive. It also makes them robust to interference. The parts of the body used to produce these sounds grow as the animal grows, and the variation in the acoustic scale of communication sounds poses a generalization/discrimination problem for the perception and recognition stages of communication. The fact that mammalian perception is robust to changes in acoustic scale suggests that the auditory system has a special pre-processor that automatically normalizes for acoustic scale as it constructs our internal `auditory images' of sounds. This paper illustrates how the auditory system might construct a `scale-shift covariant' representation of communication sounds in which the information about the size of the sender is rendered orthogonal to the message of the communication. The representation facilitates the extraction of the message. There would appear to be no comparable method of segregating scale information and extracting the message from the spectrogram of the sound.
Ralph van Dinther , Roy Patterson
Contents |
COMMUNICATION SOUNDS
The sounds that animals use to communicate at a distance, to declare their territories and attract mates, are typically pulse-resonance sounds [1]. These sounds are ubiquitous in the natural world and in the human environment. They are the basis of the calls produced by most vertebrates (mammals, birds, reptiles, frogs and fish). Although the structures used to produce pulse-resonance sounds can be quite elaborate, the mechanism is conceptually very simple. The animal develops some means of producing an abrupt pulse of mechanical energy which causes structures in the body to resonate. From the signal processing perspective, the pulse marks the start of the communication and the resonance provides distinctive information about the shape and structure of the sounders in the sender’s body, and thus, distinctive information about the species producing the sound. In the majority of animals, nature has adapted existing body parts to create the structures that animals use to produce their sounds [1]. In mammals, for example, the vocal tract is based on the tubes that carry air and food from the entrance of the nose and mouth to the lungs and stomach, respectively. As the animal grows, these tubes have to get longer to keep the nose and mouth connected to the lungs and stomach. As the vocal-tract length (VTL) increases, the resonators in the vocal tract get larger and ring more slowly. Similarly, as the vocal tract gets wider, the vocal cords get longer and more massive, which means that the glottal-pulse rate (GPR) decreases as the animal grows. The sound producing mechanism typically maintains its overall shape and structure as the individual grows. As a result, the population of calls produced by a species all have the same ‘message’, but the message is carried by sounds that vary in their resonance rate and their pulse rate. Figure 1 presents a set of four synthetic, two-formant vowels to illustrate the properties of speech sounds and the principles of auditory processing that are the focus of this paper. The figure shows that vowels are glottal pulses with complex resonances attached [1,2]. The message of these syllables is that the vocal tract is in the /a/ shape, and this message is contained in the shape of the resonance which is the same in each cycle of each vowel. The bandwidths of the formants are proportional to their center frequencies, which means that the upper formant decays faster than the lower ones in each case. The two formants can be observed interacting in the first couple of cycles at the start of each resonance; thereafter, the resonance of the lower formant dominates the waveform.
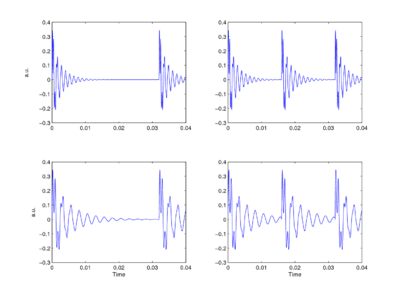
The fact that members of a species communicate their presence using calls that vary in pulse rate and resonance rate presents the listener with a classic categorization problem – how to discriminate different species and, at the same time, correctly generalizing across calls within a species [1]. Distinguishing two sounds is not difficult, especially when they vary in pulse rate and resonance rate. The problem is to isolate the resonance shape and recognize that the calls of large and small members of the species are ‘the same’ despite the fact that the calls are carried by sounds with different pulse rates and resonance rates, and also, to recognize when two calls with the same pulse rate and similar resonance rates, nevertheless represent two different species because the resonance shape is different.
THE ROBUSTNESS OF PERCEPTION TO VARIATION IN GPR AND VTL
Perceptual experiments with communication sounds show what everyone intuitively knows; auditory perception is singularly robust to changes in both the resonance rate and the pulse rate of communication sounds [2,3,4,5]. The vowels in Fig. 1 are readily discriminable but they all convey the same message, /a/. Similarly, the experiments show that we have no difficulty whatsoever understanding when a child and an adult have spoken the same the word [5], despite substantial differences in their pitches and vocal-tract lengths. We also know which speaker has the higher pitch and which speaker is bigger (i.e., which speaker has the longer vocal tract). Perceptual experiments have been performed with vowels [3], syllables [4], musical notes [2] and animal calls [6]; they all lead to the conclusion that auditory perception is singularly robust to the scale variability in communication sounds. It is also the case that the robustness of human perception extends to speech sounds and musical sounds where the pulse rate and resonance rate are scaled well beyond the range of normal experience [3], and scaled independently. The results suggest that the auditory system contains a mechanism that automatically adapts to the GPR and VTL of the sound, and produces some form of invariant representation of the message [7]. The robustness of auditory perception stands in contrast to the lack of robustness in automatic speech recognition (ASR) systems; a speech recognizer trained on the speech of a man is typically not able to recognize the speech of a woman, let alone the speech of a child. Robustness to GPR and VTL variability, which we take for granted and think of as trivial, poses a very difficult problem in ASR where it is left to the recognition system that follows the pre-processor to learn about pulse rate and resonance rate variability from a time-frequency representation like the spectrogram. The form of communication sounds and the robustness of auditory perception suggest that the auditory representation of communication sounds is somehow `shift covariant' both to changes in resonance scale (scale-shift covariance), and to changes in glottal-pulse period (period-shift covariance). If the space of auditory perception already has these properties, then more central mechanisms do not need to learn about the variability associated with GPR and VTL differences. This would help explain our facility with speech and our ability, as children, to learn speech from people of widely differing sizes.
SCALE-SHIFT COVARIANCE: THE BASIS OF PERCEPTUAL ROBUSTNESS
The concept of scale-shift covariance (as opposed to scale invariance), and how the auditory system might implement it, will be illustrated using the auditory image model (AIM) of auditory perception [2,8]. In AIM, the operation of the cochlea is simulated with a compressive, gammachirp, auditory filterbank [9], in which filter centre frequency is distributed logarithmically with frequency and the bandwidth of the auditory filter is proportional to filter centre frequency. The envelope of the impulse response is a gamma function whose duration decreases as frequency increases. This means that, mathematically, the operation of the cochlea is more like a wavelet transform [10,11] than a windowed Fourier transform, where the window duration is the same in all channels. This suggests that the auditory system is actually transforming the time waveform of sound into a {time, scale} representation [7,12], rather than a {time, frequency} representation. The {time, scale} versions of the four vowels in Fig. 1 are presented in Fig. 2. The activity in the four panels includes the operation of the hair cells and so it is intended to be a record of the neural activity pattern (NAP) flowing from the cochlea up the auditory nerve to the brain stem in response to each of these sounds. By its nature, the time dimension in this representation is linear and the NAP exists in a {time, scale} space [7].
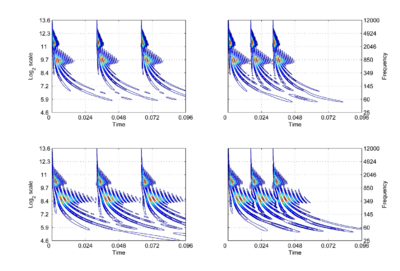
The right-hand ordinate of each panel is acoustic scale, and it is reciprocally related to acoustic frequency through the speed of sound; scale = (1/frequency)*velocity. So {time, scale} space is similar to {time, frequency} space; the right-hand ordinate is the more familiar variable, frequency, in log format. As a variable, however, scale has the advantage that it is more directly related to the wavelength of the sound, and thus, to the size of the resonators in the source. The unit of frequency is cycles per second and the unit of the velocity of sound in air is meters per second, so the unit of scale is meters per cycle. Thus, the NAP pattern in each row of one of these panels is showing the individual cycles of the mechanical vibration produced by a resonator in the source, and the ordinate gives the scale of the cycle, that is, the number of meters per wavelength. This is directly related to the physical size of the resonator that produced this component of the sound, and since resonator size is typically correlated to body size [13], the {time, scale} NAP of a sound contains valuable information about the size of the source. Although the {time, scale} representation of communication sounds is scale covariant [14], it is not scale-shift covariant. This is illustrated in Fig. 2 by the fact that a change in resonance size produces a change in the shape of the distribution, as well as its position in this time-scale space. The upper formant in each sound is a scaled version of the lower formant, but the representation of the upper formant is compressed in time with respect to the lower formant. Similarly, the distribution of activation expands in time, as a unit, when we switch from the smaller sources in the upper panels to the larger sources in the lower panels. This is the same effect in a different form. The scale information is preserved and it covaries with the dilation of the auditory figure in this {time, scale} representation. But the changes are not orthogonal; a change of acoustic scale in the sound produces a change along the time dimension of the figure as well as in the scale dimension. So, to repeat, the {time, scale} representation of communication sounds is scale covariant [14], but it is not scale-shift covariant. To achieve scale-shift covariance, we need to expand time as scale decreases so that the unit of scale (one cycle) becomes the same size in each channel. This is accomplished simply by multiplying time as it exists in each channel of the NAP of a sound (e.g., the individual rows of the panels of Fig. 2) by the centre frequency of the channel in question [7]. The unit of this new dimension is [cycles/second] X time, which reduces simply to cycles (of the resonance). This transformation is motivated by a consideration of the operators that can transform {time, scale} space into a scale-shift covariant space – operators which are, at the same time, unitary. Such operators effect coordinate transformations that preserve physical properties like energy, and they have an inverse that enables transformation in the reverse direction. The expressions for the operator, S and its inverse, S-1 are

and
 ,
,
where γ is log2(cycles), or log2c and σ is log2(scale), or log2s. The operator indicates that if we use logarithmic scale units, then the shift of the neural pattern with a change in scale will be restricted to the vertical dimension [7]; that is, it will be orthogonal to the cycles dimension. Similarly, if we use logarithmic cycle units, then the shift of the period-terminating diagonal with a change in pulse rate will also be restricted to the vertical dimension; that is, it too will be orthogonal to the cycles dimension. The expression for the operator says that the function, f, in time-scale space (on the right-hand side), is transformed into the function ‘Sf’ in {γ,σ} space by a particular exponentiation of time and scale. The normalization constant is required to make the transformation unitary. The important point for the current discussion is that this operator fixes the shape of the distribution of activation associated with the message of the sound, so that it no longer changes shape when either the pulse rate or the resonance rate change. When the {time, scale} NAPs in Fig. 2 are transformed to {γ,σ} space, they appear as in Fig. 3.
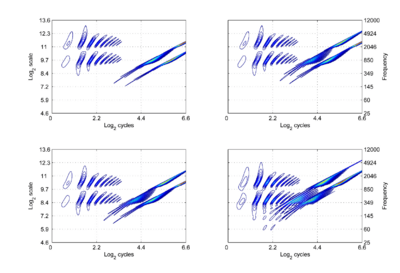
There are two striking differences between the NAPs as they appear in this new space and the more familiar {time, scale} space. Firstly, there is scale-shift covariance – the property that motivates the change of space. The activity in the first cycle of each NAP is essentially the same in all four panels. Specifically: (1) The pattern of activation that represents the message – the auditory figure – has a fixed form in all four panels; it does not vary in shape with changes in pulse rate or resonance rate. (2) When there is a change in resonance rate, the auditory figure just moves vertically, as a unit without deformation. (3) When there is a change in pulse rate, the auditory figure does not change shape and it does not move vertically; rather, the diagonal which marks the extent of the pulse period, moves vertically without changing either its shape or its angle. The other difference is that the cycles of the sound beyond the first are rotated by the time-to-cycles transformation, and compressed by the transformation from cycles to log2(cycles). The onset of the second cycle of the pattern defines the boundary of the auditory image; it is a positive diagonal (45 degree angle) and its position is defined by the scale of the pulse period, which is indicated by the point where the diagonal intersects the ordinate. The period in panel (c) is 32 ms, so σ is 5 The units are positive, because the coordinate transformation is applied to a time-scale space, where ‘scale’ is the inverse of scale as normally used in wavelet transforms. The start of the third cycle of activity is a parallel, positive diagonal that is shifted down by an octave, and so it would intersect the ordinate at 4. The rotation and progressive compression of the auditory figure in the second and third periods of the sound indicate that {γ,σ} space is not time-shift covariant. That is, successive copies of a sound have different forms. So the progression of auditory figures across this {γ,σ} NAP does not represent time as we perceive it in auditory perception. Auditory perception is time-shift covariant in the sense that we hear the same perception when a sound is played at two different times (separated by a reasonable gap). This suggests that the γ dimension is an extra dimension of auditory space, separate from time. This extra dimension is the time-interval dimension of the original auditory image [8] in the new scale-shift covariant form.
SCALE-SHIFT COVARIANT AUDITORY IMAGES
We assume that the cycles dimension combines with the scale dimension of the NAP to create a {γ,σ} plane of auditory image space, in which the resonance information attached to the latest pulse of a communication sound appears as a scale-shift-covariant auditory figure. The auditory images of the four synthetic vowels of Fig. 1 are shown in Fig. 4. The dimensions of the plane are scale and cycles in {log2(cycles), log2(scale)} form. The pattern of activation that represents the message – the auditory figure – has a fixed form in all four panels; it does not vary in shape with changes in pulse rate or resonance rate. When there is a change in resonance rate (i.e., VTL) from small to large, the activity just moves vertically down as a unit without deformation; compare the auditory figures in the panels of the upper row to those in the panels of the lower row. The extent of the shift is the logarithm of the ratio of the resonance rates of the sources. When there is a shift in pulse rate from longer to shorter, the auditory figure does not change shape and it does not move vertically; rather, the diagonal which marks the extent of the pulse period, moves vertically without changing either its shape or its angle. This changes the size of the area available for auditory figures, but does not change the shape of the figure, other than to cut off the tails of the resonances when the pulse period is short relative to the resonance duration. The extent of the vertical shift of the diagonal is the logarithm of the ratio of the pulse rates of the sources. Since the pulse rate and the resonance rate were both scaled by the same amount in this example, the vertical shift (between rows) of the auditory figure and the vertical shift of the period-limiting diagonal (between columns) are the same size.
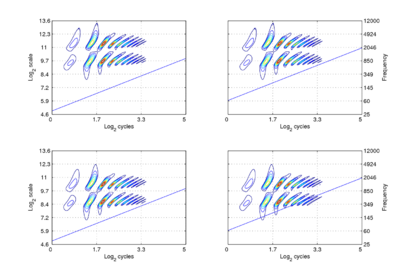
Comparison of the relative positions of the distribution of activation and the period-limiting diagonal show that the shift-covariance property applies separately to the pulse rate and resonance rate, albeit in a somewhat different form. The independence is important because, although pulse rate and resonance rate typically covary with size as members of a population of animals grow, the correlation in growth rate is far from perfect. For example, in humans, both pulse rate and resonance rate decrease as we grow up; however, whereas VTL is closely correlated with size throughout life, in males, pulse rate takes a sudden drop at puberty. The figure also illustrates one of the constraints on pulse-resonance communication; although the auditory image itself is rectangular, the auditory figures of pulse-resonance sounds are limited to the upper triangular half of the plane. The lowest component of a sound cannot have a resonance rate below the pulse rate of the sound.
SUMMARY AND CONCLUSIONS
The scale-shift covariant, auditory image, and the auditory figures produced by communication sounds in this image, would appear to provide a better basis for a model of auditory perception than the traditional {time, frequency} space and the traditional spectrographic representation of speech, inasmuch as the auditory space appears to be able to explain why it is that we can hear the message of a communication sound independent of the size of the sender. If this is the space of auditory perception rather than a {time, frequency} space, and if the mechanisms are inherited and develop as a part of the auditory system, this would help to explain how children manage to learn speech in a world where the samples they experience come from people of such different sizes (parents and siblings). It would also help explain how animals with much smaller brains and shorter life spans than those of humans manage to cope with the size variability in the communication sounds or their species and other species.
Acknowledgements
Research supported by UK MRC (G9900369, G0500221) and EOARD (FA8655-05-1-3043) and JSPS, Grant-in-Aid for Scientific Research (B), 18300060.
References
[1] R.D. Patterson, D.R.R. Smith, R. van Dinther, T.C. Walters: Size Information in the Production and Perception of Communication Sounds. In Auditory perception of sound sources. W.A. Yost, A.N. Popper, R.R. Fay (Eds), Springer Science+Business Media, LLC, New York (2007) in press
[2] R. van Dinther, R.D. Patterson: Perception of acoustic scale and size in musical instrument sounds. Journal of the Acoustical Society of America 120 (2006) 2158-2176.
[3] D.R.R. Smith, R.D. Patterson, R. Turner, H. Kawahara, T. Irino: The processing and perception of size information in speech sounds. Journal of the Acoustical Society of America 117 (2005) 305-318
[4] D. T. Ives, D. R. R. Smith, R. D. Patterson: Discrimination of speaker size from syllable phrases. Journal of the Acoustical Society of America 118 (2005) 3816-3822
[5] D.R.R. Smith, R.D. Patterson: The interaction of glottal-pulse rate and vocal-tract length in judgements of speaker size, sex, and age. Journal of the Acoustical Society of America 118 (2005) 3177-3186
[6] A.A. Ghazanfar, H.K. Turesson, J.X. Maier, R. van Dinther, R.D. Patterson, N.K. Logothetis: Vocal tract resonances as indexical cues in rhesus monkeys. Current Biology 17 (2007) 425-430
[7] T. Irino, R.D. Patterson: Segregating information about the size and shape of the vocal tract using a time-domain auditory model: The stabilised wavelet-Mellin transform. Speech Communication 36 (2002)181-203
[8] R.D. Patterson, M. Allerhand, C. Giguère: Time-domain modelling of peripheral auditory processing: A modular architecture and a software platform. J. Acoust. Soc. Am. 98 (1995) 1890-1894
[9] M. Unoki, T. Irino, B. Glasberg, B.C.J. Moore, R.D. Patterson: Comparison of the roex and gammachirp filters as representations of the auditory filter. J. Acoust. Soc. Am. 120 (2006) 1474-1492
[10] I. Daubechies: Ten Lectures on Wavelets. Conf. Series in Applied Math. SIAM, Philadelphia (1992)
[11] H.M. Reimann: Invariance principles for cochlear mechanics: Hearing phases. Journal of the Acoustical Society of America 119 (2006) 997–1004
[12] L. Cohen: The scale transform. IEEE Trans. ASSP 41 (1993) 3275-3292
[13] W. T. Fitch, J. Giedd: Morphology and development of the human vocal tract: A study using magnetic resonance imaging. Journal of the Acoustical Society of America 106 (1999) 1511-1522
[14] R.G. Baraniuk, D.L. Jones: Unitary equivalence: A new twist on signal processing. IEEE Trans. ASSP 43 (1995) 2269–2282