File:IP2008JASA Figure 08.png
From CNBH Acoustic Scale Wiki
No higher resolution available.
IP2008JASA_Figure_08.png (750 × 560 pixels, file size: 15 KB, MIME type: image/png)
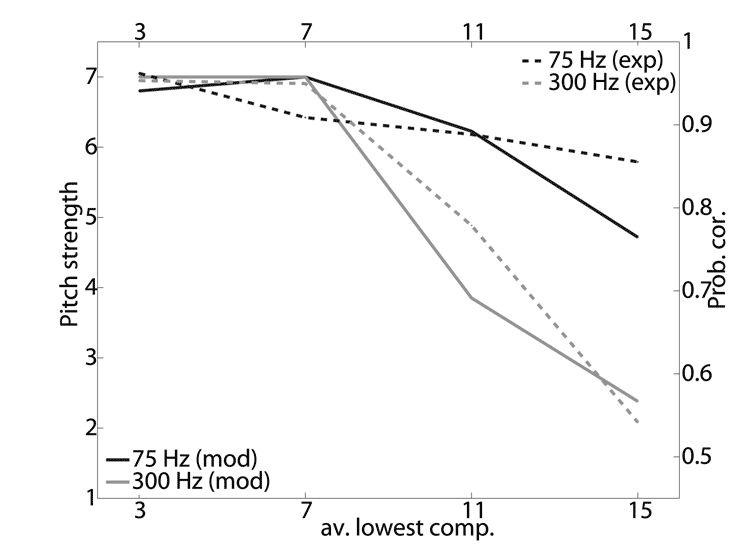
Comparison of the experimental results with pitch-strength estimates from the dual profile model, based on a gammatone auditory filterbank, for an F0 of 75 Hz (black lines) and 300 Hz (grey lines). Dashed lines are the average experimental data plotted using the right ordinate (probability of correct identification as a function of average lowest component). Solid lines are the model values plotted using the left ordinate (pitch strength as a function of the average lowest component).
File history
Click on a date/time to view the file as it appeared at that time.
| Date/Time | Thumbnail | Dimensions | User | Comment | |
|---|---|---|---|---|---|
| current | 13:56, 21 July 2008 | | 750×560 (15 KB) | Timives (Talk | contribs) | (Comparison of the experimental results with pitch-strength estimates from the dual profile model, based on a gammatone auditory filterbank, for an F0 of 75 Hz (black lines) and 300 Hz (grey lines). Dashed lines are the average experimental data plotted u) |
- Edit this file using an external application (See the setup instructions for more information)
File links
The following page links to this file: