File:Fig5 SPjasa05.PNG
From CNBH Acoustic Scale Wiki
No higher resolution available.
Fig5_SPjasa05.PNG (611 × 494 pixels, file size: 17 KB, MIME type: image/png)
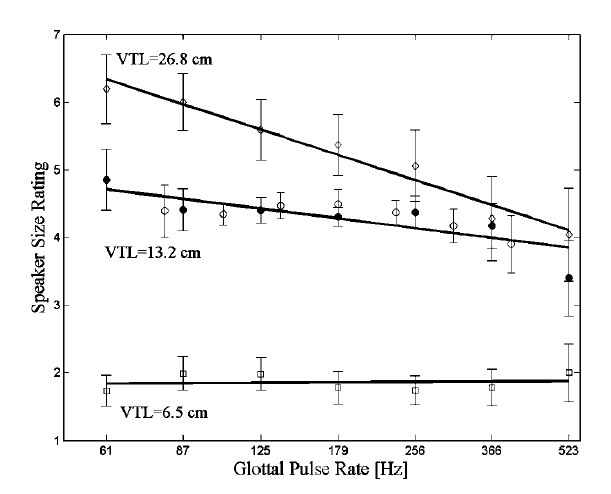
Figure 5. Perceived speaker size as a function of GPR, for VTLs of 6.5, 13.2,and 26.8 cm. The open and solid circles show data from the narrower and wider stimulus ranges, respectively. The solid lines show the best-fitting regression lines for perceived speaker size rating as a function of the natural logarithm of GPR. The error bars are ± one standard error of the mean (calculated from the average of the eight listeners). Each datum point is based on 200 trials.
File history
Click on a date/time to view the file as it appeared at that time.
| Date/Time | Thumbnail | Dimensions | User | Comment | |
|---|---|---|---|---|---|
| current | 15:51, 15 August 2008 | | 611×494 (17 KB) | AlessandroB (Talk | contribs) |
- Edit this file using an external application (See the setup instructions for more information)
File links
The following page links to this file: