File:Fig5 2005.PNG
From CNBH Acoustic Scale Wiki
No higher resolution available.
Fig5_2005.PNG (537 × 396 pixels, file size: 98 KB, MIME type: image/png)
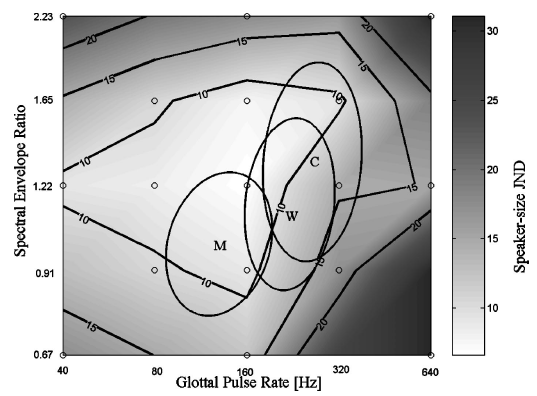
Figure 5. JND contours (expressed as a percentage of the SER) for speaker size in the speech-like experiment. The JNDs are presented as a 2D surface plot with grey tone showing discrimination performance. The JND was measured at the points shown by the circles, and the surface was interpolated between the data points. Each JND is based on a psychometric function fitted to 300 trials (60 from each of five listeners). The thick black lines show the contours for JNDs of 10, 15 and 20%. The three ellipses show the range of GPR and SER in speech for men, women and children (derived from data of Peterson and Barney, 1952).
File history
Click on a date/time to view the file as it appeared at that time.
| Date/Time | Thumbnail | Dimensions | User | Comment | |
|---|---|---|---|---|---|
| current | 15:09, 13 August 2008 | | 537×396 (98 KB) | AlessandroB (Talk | contribs) |
- Edit this file using an external application (See the setup instructions for more information)
File links
The following page links to this file: