File:Fig1 SPjasa05.PNG
From CNBH Acoustic Scale Wiki
No higher resolution available.
Fig1_SPjasa05.PNG (592 × 444 pixels, file size: 21 KB, MIME type: image/png)
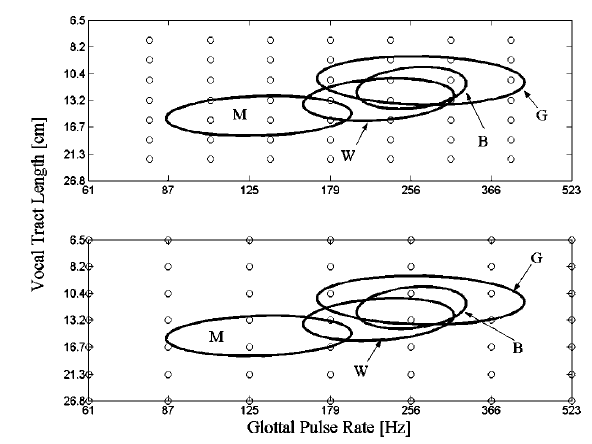
Figure 1. The open circles show the GPR and VTL combinations of the stimuli used in the speaker size and sex/age categorization experiments. The circles in the top panel show the “narrower” range of (7x7) sample points(GPRs of 80, 105, 137, 179, 234, 306, and 400 Hz; VTLs of 7.8, 9.3, 11.0, 13.2, 15.7, 18.7, and 22.2 cm). The bottom panel shows the “wider” range (GPRs of 61, 87, 125, 179, 256, 366, and 523 Hz; VTLs of 6.5, 8.2, 10.4, 13.2, 16.7, 21.3, and 26.8 cm). The four ellipses show the normal range of GPR and VTL values in speech for men (M), women (W), boys (B), and girls (G), derived from the data of Peterson and Barney (1952). Each ellipse contains 99% of the individuals from the respective category.
File history
Click on a date/time to view the file as it appeared at that time.
| Date/Time | Thumbnail | Dimensions | User | Comment | |
|---|---|---|---|---|---|
| current | 15:37, 15 August 2008 | | 592×444 (21 KB) | AlessandroB (Talk | contribs) |
- Edit this file using an external application (See the setup instructions for more information)
File links
The following page links to this file: