File:Fig10 DPjasa06.PNG
From CNBH Acoustic Scale Wiki
Size of this preview: 585 × 599 pixels
Full resolution (778 × 797 pixels, file size: 57 KB, MIME type: image/png)
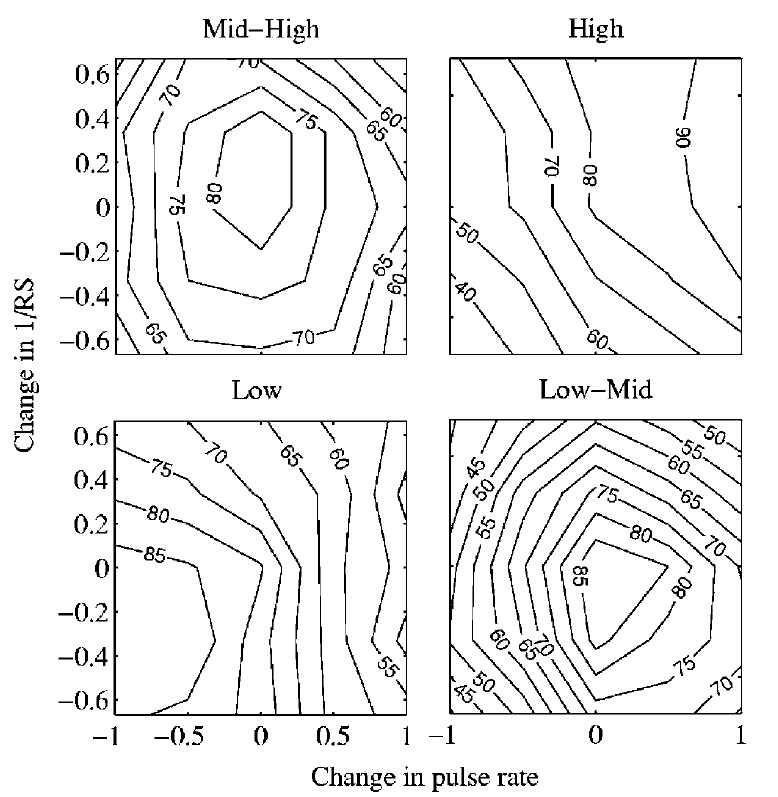
Figure 10. Percent-correct contour plots for the four registers presented in Table 2. The results are averaged across the 25 conditions and 4 listeners for each register.
File history
Click on a date/time to view the file as it appeared at that time.
| Date/Time | Thumbnail | Dimensions | User | Comment | |
|---|---|---|---|---|---|
| current | 15:28, 14 August 2008 | | 778×797 (57 KB) | AlessandroB (Talk | contribs) |
- Edit this file using an external application (See the setup instructions for more information)
File links
The following page links to this file: