CompressiveDistortion.1
From CNBH Acoustic Scale Wiki
|

Roy Patterson
Contents |
CAR-FAC systems
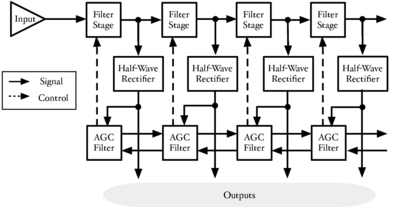
Lyon et al. (2010) showed how a cascade of simple asymmetric resonators (CAR) can be used to simulate the filtering of the passive basilar membrane (Figure 1), and how the parameters of a CAR can be manipulated with an integral AGC network to simulate the fast-acting compression (FAC) that characterizes the spectral analysis performed in the cochlea by the basilar membrane in conjunction with the outer hair cells (Figure 1). In the description of the system, Lyon et al. (2010) emphasize two advantages of the CAR-FAC as a cochlea simulation, one theoretical and one practical: The theoretical advantage is that the signal enters the system at the highest frequency element and cascades down through the stages one after another much in a way that is analogous to the way a sound travels down the basilar partition in the cochlea. The practical advantage is that the asymmetric resonance that provides the filtering can be simulated by a simple pole-zero pair in the La Place domain, with the result that the digital implementation of the system is exceptionally efficient. This suggests that CAR-FAC systems might function as cochlea simulators that are both realistic and real time. Moreover, Walters (2011) has recently implemented a version of Lyon’s CAR-FAC as a filterbank option in AIM, both in AIM-C, the real-time version of AIM, and AIM-MAT, the MATLAB version of AIM with a GUI for teaching and model development.
Compressive distortion in CAR-FAC systems
The cascade architecture of the CAR-FAC means that the compression experienced by sound in a given AR element is passed on as part of the input to the next element in the chain (Figure 1). As a result, the system might be expected to propagate distortion components generated in high-frequency elements of the chain down to the element associated with the distortion frequency, and combine all of those distortion components coherently with any stimulus energy at that frequency. This suggests that CAR-FAC systems might have a third important advantage; if they can simulate the effects of fast-acting compression in the cochlea, they could be used to study the role of compressive distortion in the perception of speech and music. Most of the parallel filterbanks that do include compression, like the compressive gammachirp and the DRNL, do not propagate the distortion products they generate because they are not filter cascades. This is a serious limitation which unfortunately reinforces the belief that the distortion caused by compression in the cochlea can largely be ignored.
The implementation of Lyon’s CAF-FAC is briefly described in a recent poster and the details of how the AGC network implements FAC are presented in Walter’s recent dissertation Chapter 5. However, neither of these documents considers the distortion that compression introduces into the neural activity pattern observed in the auditory nerve.
Examples of Compressive distortion
A tone composed of 10 adjacent harmonics

With regard to auditory perception, what matters is not so much the magnitude spectrum of the tone at the eardrum, but rather the distribution of the activity produced by the sound along the basilar membrane -- an internal representation of sound referred to as the auditory spectrum (Patterson, 1994). A tone composed of harmonics 10-20 of 200 Hz was generated and analyzed with the CAR-FAC in AIM-C to illustrate the advantage of a compressive filterbank that propagates the distortion it generates.
The auditory spectrum of the sound is shown in Figure 2. The broad peak around 3000 Hz shows the collective activity of the primaries in the region between 2000 and 4000 Hz. The primaries do not appear as individual peaks in the auditory spectrum because they are closely spaced relative to the bandwidth of the auditory filter. The low harmonics of 200 Hz were omitted from the stimulus so that the distortion tones produced by the CAR-FAC system can be observed without interference. The two low-frequency peaks in Figure 2 have frequencies of 200 and 400 Hz. They show that CAR-FAC systems do indeed generate and propagate compressive distortion to the appropriate channel of the system.
Collectively, the distortion products that appear in the auditory spectrum are referred to as the distortion spectrum (Pressnitzer and Patterson, 2001). This part of the auditory spectrum has no counterpart in the Fourier magnitude spectrum of the sound as it occurs in the air, and there is no compressive distortion in the middle ear.
This 10-component tone simulates the tones of music and speech insofar as it has a substantial number of adjacent harmonics of one fundamental. The example shows how the high, unresolved harmonics of a complex tone can produce low, resolved components in the auditory spectrum, components that can be expected to make a significant contribution to the pitch strength and the percieved register of the tone.
Note how the quasi-log-frequency axis of the filterbank changes our perspective on the frequency content of the sound from that suggested by the spectrogram with its linear frequency axis. The quasi-log-frequency axis expands and emphasizes the distortion spectrum while compressing and de-emphasizing the primaries.
Distortion spectra of CPH, APH and RPH tones

The compressive distortion observed in the cochlea is phase sensitive (Pressnitzer and Patterson, 2001). The components of the sound in the first example were all in cosine phase, and as a result, the individual distortion components produce by adjacent pairs of primaries were in phase. When the phases of the primaries alternate between 0 and 90 degrees, the individual distortion components produced by adjacent primaries are out of phase and cancel each other. The auditory spectrum of an alternating phase (APH) 10-component tone produced by the CAF-FAC is shown in Figure 3 (blue line) along with the auditory spectrum of the CPH wave (black line).
When the phases of the primaries are assigned at random, the cochlea still produces distortion but the individual components of distortion produced by adjacent pairs of primaries are not in phase and their sum is reduced. A random phase (RPH) wave was generated using the same primaries as in the CPH and APH waves and it was analyzed by the CAR-FAC system. The resulting auditory spectrum is shown in Figure 3 (red line) along with those of the CPH and APH waves, and it shows that there is a distortion spectrum with peaks at the first three harmonics of the fundamental but at a reduced level, as would be expected.
These examples provide proof of the concept that CAR-FAC systems might be able to model the compressive distortion observed in the cochlea.
Distortion spectra for tones of varying level

The level of the CPH tone was decreased repeatedly by a factor of 4 to illustrate the growth characteristic of the auditory spectrum produced by the CAR-FAC, and the growth characteristic of the distortion part of the auditory spectrum relative to that of the primaries. The level of the sound decreases 12 dB each time the wave is divided by a factor of 4. The auditory spectra for the original wave and 3 attenuated versions of the wave are shown in Fig. 4.
The internal measure of level is linear (arbitrary units) and the level of the auditory spectrum in the region of the primaries decreases by about the same amount (600-500 units) for each decrease of 12 dB in acoustic level, so the internal measure of level is roughly logarithmic. The distortion components in the auditory spectrum decrease as a unit when the sound is attenuated but their level decreases at a slower rate than does the auditory spectrum of the primaries. It appears to decrease at half the rate that the primaries decrease, so it is also a logarithmic relationship but with a different exponent.
The cancellation technique that Pressnitzer and Patterson (2001) used to measure the distortion spectrum is described in the next section where the observed distortion spectrum is compared the compressive distortion produced by the CAR-FAC.
- Perceptual evidence of compressive distortion: indirect measures
- When is distortion perceived as DIstortion ?
- The traditional description of distortion
References
- Lyon, R.F., Katsiamis, A.G. and Drakakis, E.M. (2010). “History and Future of Auditory Filter Models.” OriginalCiteRef : . Booktitle : IEEE International Symposium on Circuits and Systems, 2010. ISCAS 2007. [1] [2]
- Patterson, R.D. (1994). “The sound of a sinusoid: Spectral models.” J. Acoust. Soc. Am., 96, p.1409-1418. [1]
- Pressnitzer, D. and Patterson, R.D. (2001). “Distortion products and the pitch of harmonic complex tones”, in Physiological and Psychophysical Bases of Auditory Function, Breebaart, D.J., Houtsma, A.J.M., Kohlrausch, A., Prijs, V.F. and Schoonhoven, R. editors, p.97-103 (Shaker). [1] [2] [3]